Download
1 / 19
190 likes | 254 Views
Using satellite observations to investigate natural aerosol loading. Colette L. Heald David A. Ridley, Kateryna Lapina. UPMC Paris March 22, 2011. DUST FROM NORTH AFRICA: IMPACTING AQ AND THE BIOSPHERE DOWN-WIND. More than half of dust emitted globally from N. Africa.

E N D
Using satellite observations to investigate natural aerosol loading Colette L. Heald David A. Ridley, KaterynaLapina UPMC Paris March 22, 2011
DUST FROM NORTH AFRICA: IMPACTING AQ AND THE BIOSPHERE DOWN-WIND More than half of dust emitted globally from N. Africa TOMS: June 13-21, 2001 summer winter/spring Miami (1989-1997) French Guiana (1978-1979) [Prospero et al., 1981] [Prospero et al., 1999]
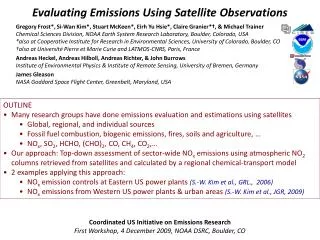
SATELLITE CONSTRAINTS ON DUST SOURCE & TRANSPORT GEOS-Chem overestimates observed AOD in source region, underestimates summertime export Dave Ridley
REALISTIC APPORTIONMENT OF SUB-MICRON DUST MASS Observed Saharan dust size distribution Simulated decrease in AOD [Haywood et al., 2003] OLD NEW Shifted mass to larger sub-micron sizes (less optically efficient). Reduces AOD in better agreement with satellite & AERONET observations
DUST TRANSPORT FROM NORTH AFRICA Annual Mean AOD SUMMER WINTER CALIOP GEOS-Chem CALIOP GEOS-Chem Good model simulation of dust transport and removal in winter/spring. Underestimate in dust in the SAL in summertime.
DEPOSITION OF AFRICAN DUST & PHOSPHOROUS IN THE AMAZON ANNUAL We estimate 13 Tg/yr transported to Amazon annually. This is ~10-25% of the P supply for the Amazon. Otherwise from fires and biogenic particles [Mahowald et al., 2005]. Impact of greening of the Sahel on productivity of the Amazon? [Ridley et al., in prep]
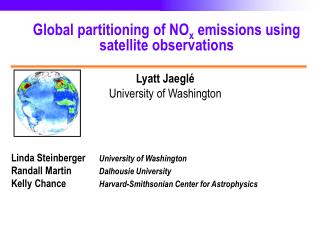
ANNUAL MEAN AOD OVER THE REMOTE OCEANS MODIS GEOS-Chem Gong [2003] sea salt scheme updated to include SST dependence & validated against observations [Jaeglé et al., 2010] % Difference GEOS-Chem Sea Salt GEOS-Chem underestimates (~30%) marine AOD observed by MODIS . Likely fine aerosol [Jaegle et al., 2010], but does not match simulated sea salt. Kateryna Lapina
COMPARISON WITH MARTIME AEROSOL NETWORK (MAN) Model AOD (over remote regions) is also ~13% low compared to MAN
OTHER POSSIBLE FINE MARINE PARTICLE SOURCES Comparison of simulated sulfate to recent cruise observations (AMS) Observed aerosol composition at Mace Head SeaWIFS [O’Dowd et al., 2004] GEOS-Chem simulation of sulfate relatively unbiased not the problem. BUT under biologically active conditions, OA dominates sub-micron aerosol mass.
IS THE OCEAN AN IMPORTANT SOURCE OF OA? Previous estimates range from 2.3 to 75 TgC/yr No marine OA With marine OA OA Emissions Observations from 5 ship cruises show that marine OA from 2 schemes [Spracklen et al., 2008; Langmann et al., 2008] of ~8 TgC/yr are more than sufficient to reproduce sub-micron OA. Makes very little contribution to AOD (0.003). [Lapina et al., ACPD, 2011]
ORGANIC AEROSOL MAKES UP AN IMPORTANT FRACTION OF OBSERVED AEROSOL Sulfate Organics [Zhang et al., 2007] Globally makes up 25-75% of total fine aerosol at the surface (ignoring soot here)
CHALLENGES IN MODELING THE RIGHT LEVELS OF OA AMMA ITCT-2K4 IMPEX AMAZE-08 Egbert [Volkamer et al., 2006] SOA measured/modeled = 4-100! Models do get it right sometimes (even more puzzling?) but is it for the right reason?
WHY DON’T MODELS GET IT RIGHT…. 10,000’s of (unidentified?) compounds with variable properties Continuing Oxidation/Partitioning in the Atmosphere Uncertain Formation (Missing sources? Poorly understood processes?) Hydrocarbons (gas-phase & particulate) Terpenes (gas-phase) PBAP
CAN SATELLITE OBSERVATIONS SHED ANY LIGHT ON THE BUDGET OF OA? Bottom-up calculations suggest that SOA source may be anywhere from 140-910 TgC/yr [Goldstein and Galbally, 2007]. SATELLITE AOD Assumptions: Optical Properties Size Distributions Aerosol Distributions AEROSOL SPECIATED MASS CONCENTRATIONS Dust Organic aerosol Sulfate Sea Salt Nitrate Soot SURFACE REFLECTANCE
IF ONLY AEROSOL IN THE ATMOSPHERE WAS OA, WHAT LOADING IS IMPLIED BY SATELLITE AOD? Calculate the “hypothetical” AOD implied by a constant 1 g/sm3 profile over the land, and see how we need to scale this locally to make up ENTIRE AOD reported by MISR. Inverted total MISR AOD: Surface OA concentrations Inverted OA loading is 3.5 TgC over land. Assume a 6 days lifetime = 215 TgC/yr extrapolate to include outflow ~430 TgC/yr. (middle of Goldstein & Galbally range)
A MORE REALISTIC POSSIBILITY:REMOVE CONTRIBUTIONS FROM DUST, BC, INORGANICS(assuming all the negative bias in the model is ONLY OA) DJF JJA Estimate that ~150 TgC/yr source is required to close the MISR-GEOS-Chem* discrepancy. MISR GEOS-Chem* MISR- GEOS-Chem* *excluding OA
UNCERTAINTY ANALYSIS (boring but important!) Estimated uncertainty on OA budget due to: Uncertainty on OA optical properties Assumed optical properties based on GADS database and log-normal size distribution recently evaluated by Drury et al. [2010] * Except over high RH regions Uncertainty on estimated OA source = 80%
HAVE WE REDUCED THE UNCERTAINTY ON THE OA BUDGET? 910 Range estimated by: Goldstein and Galbally [2007] This is more than THREE TIMES what is currently included in global models…. BUT at the low end of Goldstein & Gallbally [2007] range. 140 Our satellite top-down estimate 150 47 Existing GEOS-Chem sources All units in TgCyr-1 [Heald et al., 2010]
Acknowledgments: Easan Drury, Sonia Kreidenweis, Dominick Spracklen, Steve Arnold, James Allan, Hugh Coe and Gordon McFiggans, Soeren Zorn, Frank Drewnick, Tim Bates, Lelia Hawkins, Lynn Russell, Sasha Smirnov, Colin O’Dowd, Andy Hind and MISR, MODIS & CALIOP retrieval teams