Download
1 / 26
260 likes | 264 Views
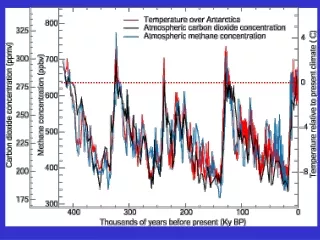
This talk explores the detection and attribution of changes in Arctic ecosystems and atmospheric CO2 using long-term measurements and remote sensing data. It examines the implications for carbon uptake and explores the role of various factors such as fossil fuel emissions, terrestrial biosphere, oceanic exchange, and atmospheric transport. The talk also discusses the impact on net CO2 uptake and presents inverse modeling of surface fluxes. The findings highlight the need for further improvements in monitoring and modeling to understand the mechanisms driving CO2 variations in the Arctic region.

E N D
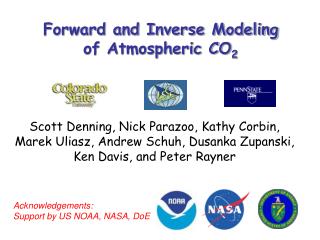
Detection and attribution of changes in arctic ecosystems and atmospheric CO2 P. K. Patra, H. Kobayashi and T. Saeki Department of Environmental Geochemical Cycle Research Acknowledgements to Graven et al., Science, 2013 At A-CG36 : Science in the Arctic Region, JpGU Pacifico Yokohama, 30 April 2014
Talk outline • Introduction • Detection of atmospheric CO2 change from longterm measurements • Changes in vegetation phenology by remote sensing • Implications for carbon uptake by inverse modeling of atmospheric CO2
Example of decomposing CO2timeseries at Barrow (71oN), Alaska Due to fossil fuel Measurement CO2 trend (ppm) CO2 concentration (ppm) Climate, Fires, Volcano Terrestrial biosphere CO2 seasonal cycle (ppm) CO2 growth rate (ppm) Fortran Program by Nakazawa et al., 1997
Attribution of changes Atmospheric CO2 = fossil fuel emission + terrestrial biosphere + oceanic exchange + atmospheric transport Strong trends Strong seasonality Weaker seasonality Weaker trends Most studies looked in to a particular aspect, e.g., Graven et al. : atmospheric CO2 Piao et al. : terrestrial ecosystem model Role of terrestrial biosphere, fossil fuel emissions, oceanic exchange and atmospheric transport remained relatively unexplored
Partitioning of global CO2 sources and sinks 2002 - 2011 1750 - 2011 2011 365±30 8.3±0.4 9.5±0.5 180±80 1.0±0.5 0.9±0.5 CO2 Fluxes (PgC yr-1) 150±90 2.6±0.8 3.8±0.9 (Residual) (Residual) (Residual) 240±10 4.3±0.1 4.1±0.1 (Observations) (Observations) (Observations) 155±30 2.5±0.5 2.7±0.5 (5 models) (5 models) (5 models) Le Quere et al. 2013, ESSD; updated from www.whrc.org
Large increase (up to 60%) in land carbon exchange (between IGY/1960 and IPY/2010) Lack of representation in CMIP5/IPCC-AR5 models (independent evaluation critical) Graven, Keeling, Piper, Patra et al., Science, 2013
Attribution of changes (results from Hideki Kobayashi) Changes in boreal ecosystem
CO2 seasonal cycle: definitions Peak to peak amplitude Terrestrial source 0 Zero-crossing (Onset) Terrestrial sink Zero-crossing (Offset)
Vegetation phenology estimation Satellite data: SPOT VEGETATION S10 from 1999 to 2012, @1/112 degree NDVI >0.3 threshold for onset/offset (NDVI 0.3) NDVI50% of max-min NDVI threshold for onset/offset (NDVI 50%) NDWI minimum for onset (NDWI) NDWI minimum method (Delbart et al.., 2005) NDVI threshold methods (White et al., 1997, 2009) Onset Onset Offset
CO2 zero crossing vs. vegetation onset/offset at Barrow • Barrow CO2vs Satellite onset/offset estimates in {68-72oN and 140-180oW} • Day anomalies show earlier trend both in zero-crossing and spring onset • Autumn offset delayed a little in the satellite estimates, but almost constant Spring onset anomaly Autumn offset anomaly
Autumn offset anomaly Spring onset anomaly
CO2 seasonal amplitude and vegetation growing season length (GSL) at Barrow/Alaska • Barrow CO2vs Satellite growing season length in {68-72oN and 140-180oW} • Increase in the CO2 amplitude coincides with increase in the GSL
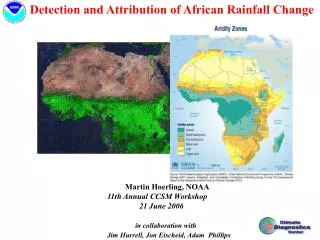
Attribution of changes (results from Tazu Saeki) effect on net co2 uptake
Inverse modeling of surface fluxes • Bayesian synthesis inversion Input : • Transport model simulations at monthly-mean timestep • Monthly-mean atmospheric CO2data Output: monthly CO2 fluxes and uncertainties for 84 partitions of the globe for 1990-2011. CO2 & Transport model CO2 fluxes Rayner et al., 1999; Baker et al., 2006, Patra et al., 2005
Fluxes from 84 partitions of globe using CO2 obs. at ~100 sites and ACTM transport are estimated Global totals and semi-hemispheric CO2 fluxes CO2 flux [PgCyr-1]
Recent changes in annual mean CO2 fluxes Boreal Eurasia Boreal North America CO2 flux [PgCyr-1] Northern Ocean Europe Northern Ocean Bor. N. Am. Boreal Eurasia Europe
Summary and outlook • The CO2 seasonal cycle amplitude has increased since the direct measurements started in 1950s • Bottom-up and top-down flux estimations suggest more exchange between carbon pools in the last century • However the sub-hemispheric or regional carbon fluxes and their exchange mechanism remain largely unknown • Further improvements in monitoring and modeling of the ecosystems are required for attribution of CO2 variations
EndQ (chair - Inoue?): What is the role of Arctic sea-ice change?A: Here our inverse model suggest the Northern Ocean sink is reducing with time. That means sea-ice reduction is not helping us to sequester more carbon from the atmosphere. (Later I thought more about it! The sea-ice melt should increase stability of surface water and thus slower vertical mixing – so a reduction in CO2 uptake even though the surface water is undersaturated for CO2. Although some nutrients supply would also increase, but that may not be playing significant role in CO2 flux change)Q (Tohjima): why are the changes in Arctic vegetation?A: Mainly the increase in temperature. There are two main changes in the divers, the surface temperature and CO2 fertilization. But the CO2 fertilization should be rather uniform globally. So I feel the temperature change is the main cause of arctic greening.
Notes (30 Apr 2014; Arctic Environment): 3rd talk (by Tanaka): The great cyclone of 2012 in Arctic Ocean: 2012 08 03For frequency and statistics of arctic cyclones : Simmonds and Rudeva (2012). One may check N2O STE using MLS observations and ACTM simulations4th talk: Inuoe et al. (2012) – warm arctic and cold siberia (wacs)6th talk (Tanaka) : AOI. Interesting analysis of AO eigenmodes (linear+nonlinear+forcing). While the linear term is in phase with the AOI, the forcing term leads the AOI (not sure I understand fully) 7th talk (enomoto) : Arctic data archive system – ADSQ (patra) : great collection of data, but how to use and think together? Need a workshop?A. Yes, let’s talk and discuss with Ibuki-san and others8th talk (Aoki): greenland snow change – albedo (bc & dust) etc. 9th talk : GRACE greenland ice sheet (Sasgen et al., EPSL, 2012) and IceSATxx talk (Kuchiki?) : albedo decrease with snow grain size, ~1 at 1um to <0.5 at 1000 um. Albedo also decrease as the impurity (bc &dust) increase – more sensitive at coarser grain size. Measured EC, OC, BC and dust during 2012-2013 at NyAlesund. Without BC in Savalband, the Albedo should have been -0.02 to -0.03 (or higher)
Notes (01 May 2014; Future Earth, Atmos. Chem): Future Earth (9am): Keywords : transformation (to all meat eating?), sustainability (your industries?), co-design/co-production (impossible, from what I have seen – but somehow helps some people to become rich!), planetary boundary (account for the past?)2nd talk (emori) : talked about next 100 years, but model do not explain past 10 years!)3rd talk (by ozaki): peat fire and carbon management in Indonesia. 11am (Taniguchi) : GEC projects – FE core projects (27?), Global hub: Boulder, Montreal, Paris, Stockholm, Tokyo(??), Regional hub: Asia-Pacific, …. Three big efforts: Dynamic planet – 1. Observing, Monitoring, Modeling; 2. Global development – footprint (Taylor et al., 2012), Developing Asia in trouble??, 3. Transformation towards sustainability (Kumamoto city example) – good practiceAtmos. Chem (11:30 am):Umezawa : CH3CL emission: tropical plants – 50%, bio burn – 25%,(Xiao et al., ACP, 2010). CARIBIC conc over FRT higher than MHD, and seasonal minimum in September. CH3Cl has seasonal peak in Aug over India.Ishidoya : Exchange ratio of CO2:O2 are different for GPP (tree bag) and RH (chamber) = 1.1 & 1.01 respectively Tohjima : El Nino (-ve CO2, +APO, -NPP), La Nina (+ve CO2, -APO, +NPP)Sugawara : Cl in stratosphere (McCarthy et al., 2003) – CSIRO data. Land processes (2:15 pm)Yoshimura: heavy isotopes from ET, lighter from Evap. (Henderson & Sellers). Domination of land ET (Jasechko et al, Nature, 2013). d18O reducing from ~1910 to upto~1980, and recently has started to increase (in prep.). EnKF-OSSI done on SCIA,…,TES, IASI data of delD(?), with max impact from IASI having daily snap shots. PKP not asked: Can you estimate ET or E using d18O as a constraints?
Seasonal amplitudes at Northern Hemisphere flask sites have grown by 20-40% Point Barrow Mauna Loa Keeling et al. 1996; Cleveland et al. 1983; Randersonet al. 1997, 1999
Comparison of seasonal cycles between the IGY and HIPPO eras at flask sites Mauna Loa 1961-64 and 2009-11 means 18 ± 7 % increase in amplitude Point Barrow 1961-64 and 2009-11 means 41 ± 8 % increase in amplitude Uncertainties based on biweekly standard error in 3-harmonic fits
Atmospheric-CO2 variability and its controls Patra et al., Tellus, 2005 (updated)
Why arctic? (right) Trends in earth’s surface temperature (source: NASA/GISS) increase between 1951-1980 and 2004-2013 (down) CO2 seasonal cycle amplitude and amplitude change between 1960 and 2000 Revise this figure for CASA+OCN+FOS and trends: ~/trans_uair/analysis_igy50/plot2d/scamp_fdif.gs
Example of vegetation onset and offset Decadal mean onset and offset (1999 to 2012) Spring onset (NDVI 50 %) Autumn offset (NDVI 50 %)