Download

1 / 19
190 likes | 262 Views
Population Pyramids. Demographics of age and gender. Population Pyramid. Bar graph Displays age and gender

E N D
Population Pyramids Demographics of age and gender
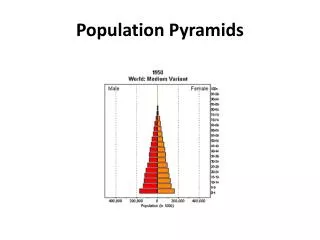
Population Pyramid • Bar graph • Displays age and gender • A population pyramid normally shows the percentage of the total population in five-year age groups, with the youngest group (0 to 4 years old) at the base of the pyramid and the oldest group at the top.
Shape Matters! o The general shape of the pyramid tells you about the character of the country, state, province, or city diagrammed. In the case of countries, pyramid shapes are indicators of growth rates and level of economic development.
United States 1950 152,271,000 population
United States 1975 Population 215,973,000
United States 2000 Population 282,172,000
United States 2009 Population 307,212,000
China 2009 Population 1,338,613,000
Sources • U.S. Census Bureau – International Database: http://www.census.gov/ipc/www/idb/ • Cracking the AP Human Geography Exam, The Princeton Review, 2010