Download

1 / 19
330 likes | 1.02k Views
POPULATION PYRAMIDS. Objectives. WHAT is a population pyramid? HOW to read a population pyramid? Recognise SHAPES of population pyramids. IMPORTANCE of population pyramids. WHAT IS A POPULATION PYRAMID?.

E N D
Objectives • WHAT is a population pyramid? • HOW to read a population pyramid? • RecogniseSHAPESof population pyramids. • IMPORTANCE of population pyramids.
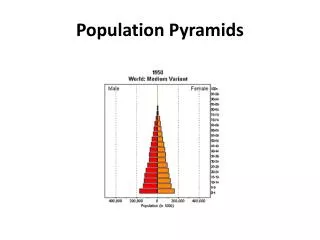
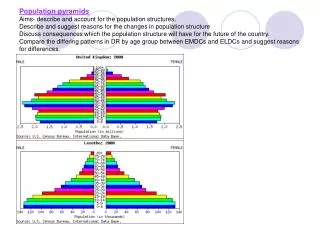
WHAT IS A POPULATION PYRAMID? • It is a diagram that gives information about the proportion of males and females in each age group. • Policy Planning • future housing estates • future schools • future jobs • Comparison with other countries • developed (US) vs developing (India) • Normally Males are on the left side and Females are on the right side • Age categories are in 5 year intervals labeled up the center • Age groups are divided into: - proportion of young people (0 -14 ) - proportion of working people (15 – 59) - proportion of elderly people (60+) • The horizontal axis is measured in numbers appropriate for the country. • Each pyramid tells a story about the past, present & future of a country & its people
What is a population pyramid? Vertical Axis - Age Groups Elderly dependents Working population Young dependents Horizontal Axis – Percentage / number
HOW TO READ A POPULATION PYRAMID? • Read the title e.g. country or city or racial group • Comment on general shape of the pyramid • Note the proportion of people in various age groups • Note the sex ratio • Interpret the data
WHAT TO LOOK FOR IN A POPULATION PYRAMID? • SHAPE OF THE SIDES • Concave (curved in) sides indicates a high death rate and convex (curved out) indicates a low death rate.
Hong Kong 2000 Taiwan 2000
Hong Kong 2000 Taiwan 2000
WHAT TO LOOK FOR IN A POPULATION PYRAMID? • WIDTH OF THE BASE • Birth rates varies with the width of the base. A WIDE base indicates high birth rate and a NARROW base indicates low birth rates
Indonesia 2000 Malaysia 2000
WHAT TO LOOK FOR IN A POPULATION PYRAMID? • Bumps in the sides or Symmetry • Statistically speaking pyramids should be relatively symmetrical. Any ASYMMETRY indicates a difference in the male and female population. IRREGULARITIES in the sides indicate a demographic difference.
UK 2000 Netherlands 2000
RAPID GROWTH • Population pyramid that has a triangular / pyramid shape • Wide base of this population indicates a HIGH birth rate • Narrow top indicates HIGH death rate • Rapid Growth indicates Lower Standard of living. • High birth rate due to poor access to lack of birth control, education • High death rate due to lack of medication, education, nutrition
SLOW GROWTH • Stable populations are characteristics of high standard of living due to: • Low birth rate due to good family planning, access to birth control, financial planning, education • Low death rate due to good medical care, nutrition, education
NEGATIVE GROWTH • Negative growth population have a narrower base that the reproductive age population • This indicates decrease population trend • Low birth rate reveals a more developed country
COMPARISON WITH OTHER COUNTRIES • MORE DEVELOPED COUNTRIES • Countries with high level of development and great deal of technology and manufacturing • Great number of automobiles, doctors, computers, telephones • Low Death Rates • High Standard of Living • Very good Healthcare • Literacy rate in the 90’s • Per Capita incomes $30,000 and above • Low Birth Rates • United States, Australia, France, Germany, Japan, England
COMPARISON WITH OTHER COUNTRIES • NEWLY INDUSTRIALIZED COUNTRIES • Increase in income but standard of living has not improved (barely going through (INDUSTRIAL REVOLUTION) • Medium to Low death rate • Improving standard of living • Improving Health Care • Literacy Rates in the 70% to 80% • Per Capita Incomes rising $10,000-$30,000 • Birth Rate Declining • Brazil, Russia, India, China, Mexico
COMPARISON WITH OTHER COUNTRIES • LESS DEVELOPED COUNTRY • Countries in the process of becoming industrialized, not economically advanced • Concentrated on agriculture, lack investment, small amount of doctors and hospitals • High Death Rate • Low Standard of Living • Poor Health Care • Low Literacy Rates-Below 50% • Low Per Capita Incomes $0-$5,000 • High Birth Rate • Afghanistan, Countries in Africa,