Download

1 / 14
150 likes | 277 Views
Population Pyramids. Dependency Ratio. The number of people who are too young or too old to work, compared to the number of people in their productive years . Dependency Ratio. 0-15 = Dependents 16-64 = Workers 65+ = Dependents DR = Number of Dependents (0-15 and 65+)

E N D
Dependency Ratio • The number of people who are too young or too old to work, compared to the number of people in their productive years
Dependency Ratio • 0-15 = Dependents • 16-64 = Workers • 65+ = Dependents • DR = Number of Dependents (0-15 and 65+) Number of Working-age (16-64) X 100
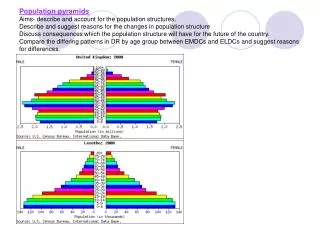
Population under the age of 15 - usually shown as a percentage of the total population of a country - dependency age is 0-15
Gender Ratio • Gender (Sex) Ratio: number of males per hundred females • In general more males are born than females • Males have higher death rates • Examples: Europe and North America = 95:100 Rest of World = 102:100
GenderRatio – Developing Countries • Have large % of young people –where males generally outnumber females • Lower % of older people – where females are typically more numerous • High immigration = more males
Population Pyramids • A country’s stage in Demographic Transition gives it a distinctive population structure • Also called Age/Sex Pyramids
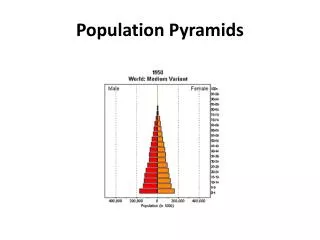
Population Pyramid • Population composition on graph: • Males = left side of the vertical axis • Females = right side of the vertical axis • Age = order sequentially with youngest at the bottom and oldest at the top (usually by five-year cohorts)
Rapid Growth • A country in stage 2 of the Demographic Transition Model • Large number of young people and a smaller older population
Slow Growth • A country in stage 4 of the Demographic Transition Model • Large number of “older people” • Smaller % of young people
No Growth • End of stage 4 • Large number of “older people” • Very small % of young people
Population Pyramid Summary for United States: 1950, 2025, 2050 • Population Pyramid Summary for United States: 1950, 2025, 2050
Population Woes for East Asia • China (1/5th of the world’s population • One-child policy-implemented in 1979, prevented over 400 million births. Reduced TFR from 5.3 to 1.5 • Fall in fertility rates due to improving economic and social factors in urban areas • Late-term abortions encouraged • Baby girls sold for average of $3,000/baby • Couples are fined $3,000 per additional child beyond one in urban areas WHAT WILL THEIR FUTURE PYRAMID RESEMBLE? • Japan • 1970s-BR 2.1/2010-BR 1.26 • Japanese are living longer • Highest proportion of elderly in the world • Currently 20% of population is over 65 • By 2040-40% will be over 65 WHAT WILL THEIR FUTURE PYRAMID RESEMBLE?