Download
1 / 16
170 likes | 387 Views
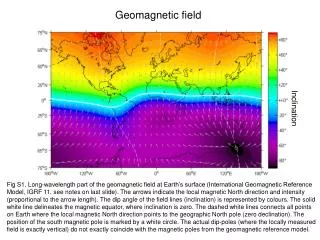
An analysis of long-term variations of Sq and geomagnetic activity. Relevance in data reduction for crustal and main field studies Crisan Demetrescu, Venera Dobrica Institute of Geodynamics, Bucharest, Romania, crisan@geodin.ro

E N D
An analysis of long-term variations of Sq and geomagnetic activity. Relevance in data reduction for crustal and main field studies Crisan Demetrescu, Venera Dobrica Institute of Geodynamics, Bucharest, Romania, crisan@geodin.ro Acknowledgements: The study has been supported by the Institute of Geodynamics (Projects 2/2004, 2005).
Outline Introduction Geomagnetic indices - geomagnetic activity - solar daily variation Long-term variations Conclusions
Geomagneticindices to quantify long-term external field variations (1) Geomagnetic activity (aa, IHV, IDV) - is the result of variable current systems formed in the magnetosphere and ionosphere as a consequence of interaction of the solar wind with the magnetosphere; Solar daily variation (x, y, z, r) - the ionospheric layers are created and maintained by the solar UV radiation. Solar tidal motions of the ionosphere and thermally driven ionospheric winds produce a regular daily variation SR by dynamo action;
Geomagneticindices to quantify long-term external field variations (2) aa – (Mayaud, 1972; 1980) The average, for each 3-hour period, of the K indices from two near-antipodal stations after the transformation of K into amplitudes; cancellation of local diurnal ionospheric effects ● widelyused to depict long-term variations of the geomagnetic activity; ●long-term similarity between aa and R in terms of 11-year running averages (Feynman & Crooker, 1978; Feynman, 1982; Silver, 1992; Cliver et al., 1998) ●heliospheric conditions at 1 AU (IMF strength, SW speed & density) account for the upward drift in the 20th century (Stamper et al., 1997) ●calibration problems – (Svalgaard et al., 2004)
Geomagneticindices to quantify long-term external field variations (3) IHV – (Svalgaard et al., 2004)to avoidcalibration problems The InterHour Variability index = the sum of differences, without regard to the sign of hourly means (or values) for a geomagnetic component from one hour to the next over the six hours interval around local midnight where the SR variation is absent or minimal ● Mursula et al., 2004 and Mursula&Martini, 2005 - latitudinal dependence, corrections of early data ● Svalgaard & Cliver, 2007 – global IHV index - responds to BV02
Geomagneticindices to quantify long-term external field variations (4) IDV – (Svalgaard & Cliver, 2004) The InterDiurnal Variability index = the unsigned difference between two consecutive days of the averaged values of the field component (usually H) for the hour taken to start one hour after local midnight and asigned to the first day - controlled by the IMF strength
Geomagneticindices to quantify long-term external field variations (5) - Solar quiet daily variation Sq x, y, z, r – (Le Mouël et al., 2005) Defined as daily ranges based on hourly means of the three components of the geomagnetic field X, Y and Z ● in terms of 11-year averages – similarity with aa and R – “overall trend of the geomagnetic field” ● both EM radiation and corpuscular flux in the vicinity of the Earth are subject to the same time variations on the time-scale considered. • A common trend is present also at longer time-scales: • 22-year • “secular”, “80-90 year”, Gleissberg cycle
Successive extraction of the 11-, 22- and ~80-year variations (running averages) The contribution of the 22-year and GC signals in aa amounts to ~30% of 11-year cycle no. 22 amplitude (4-5 nT)
reduced to their mean over the common interval and scaled with their standard deviation as unit
Correlation coefficients 22-year scale aa/R 0.67 IDV/R 0.88 GC scale aa/R 0.98 IDV/R 0.99 At both the 22-year scale and the GC scale • the coronal source field - as reflected by general heliospheric conditions at 1 AU – aa, IHV • - as reflected by the IMF strength at 1 AU – IDV • the photospheric magnetic field – R • the solar radiative output – x, y, z, r, S • have a similar behaviour, being subject to similar long-term variations caused by processes developing in the Sun
Presence of long-term variations in annual means of observatory data Steady variation Successive filtering out of the sunspot cycle signature, which is not completely averaged out in the annual mean, of a 22-year variation, and of a ~80-year variation present in the time series of observatory annual means, by running averages with 11-, 22- and ~80-year windows respectively, results in a so called “steady variation” (full green line). The dashed green line – extrapolation of the steady variation. The 11- (red), 22- (blue) and ~80-year (green) variations extracted from data. Dashed green line-extrapolated ~80-year variation
Conclusions - the contribution of the 22-year and GC signals in aa index amount to ~30% of 11-year cycle no. 22 amplitude (4-5 nT); • while the 11-year variation in the observatory annual means is clearly related to the solar cycle, the larger amplitude of the 22-year and of the ~80-year variations (40-70 nT and, respectively, 500-600 nT peak to trough as compared to 20-40 nT) points to a core source; • at a time when fine structures in geomagnetic models such as ocean tide and ocean currents effects are found, 4-5 nT seen in the long-term external variations might become significant for modelers as concerns the main field. At present only the 11-year external contribution is considered.
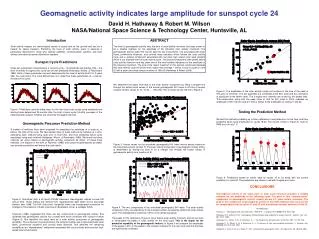
Geomagnetic and solar activity The relationship between the solar activity and short-term variations in the geomagnetic field has been known for a long time. As a matter of fact, the study of geomagnetic phenomena such as geomagnetic storms and substorms, bays and pulsations, together with astronomical observations and studies, made possible the advancement of solar and magnetospheric physics and the development of the solar-terrestrial science. Lockwood et al., 1999
The extracted 11-year variation The extracted ~80-year variation The extracted 22-year variation