Download
1 / 16
160 likes | 343 Views
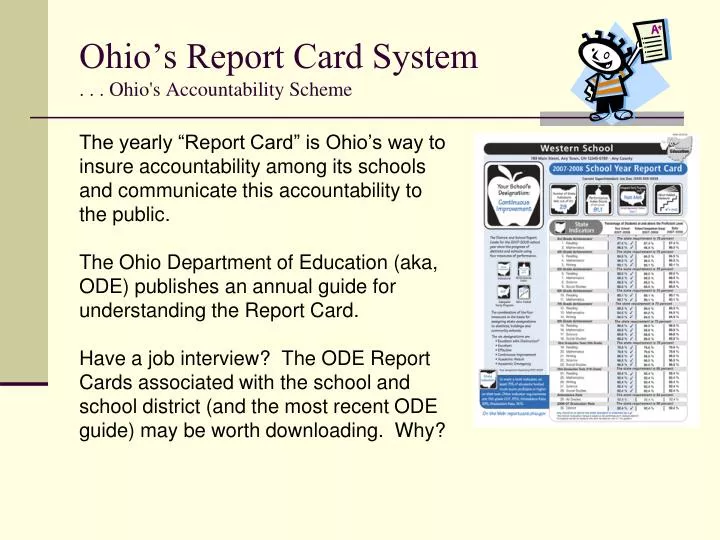
Ohio’s Report Card System . . . Ohio's Accountability Scheme . The yearly “Report Card” is Ohio’s way to insure accountability among its schools and communicate this accountability to the public.

E N D
Ohio’s Report Card System. . . Ohio's Accountability Scheme The yearly “Report Card” is Ohio’s way to insure accountability among its schools and communicate this accountability to the public. The Ohio Department of Education (aka, ODE) publishes an annual guide for understanding the Report Card. Have a job interview? The ODE Report Cards associated with the school and school district (and the most recent ODE guide) may be worth downloading. Why?
Ohio School Performance Designations . . . Part I • Schools and school districts “earn” designations from the State of Ohio based on their performance. These designations are: • Excellent with Distinction • Excellent • Effective • Continuous Improvement • Academic Watch • Academic Emergency • The School Year Report Card contains the evidence on which these designations are based and includes four components (next slides).
State Report Card(Component 1 – State Indicators . . .) • State Indicators - The State Indicators vary by year, but are generally based on the number of state assessments given over all tested grades. To earn each indicator, a district or school needs to have a certain percentage of students reach proficient or above a given assessment. Eighteen of the 2006-2007 State Indicators are: Meeting or exceeding the goal of 75 percent proficient or above on: • 3rd-grade achievement tests: reading, math • 4th-grade achievement tests: reading, math, writing • 5th-grade achievement tests: reading, math, science, social studies • 6th-grade achievement tests: reading, math • 7th-grade achievement tests: reading, math, writing • 8th-grade achievement tests: reading, math, science, social studies
State Report Card(Component 1 – State Indicators - continued . . .) • Twelve of the 2006-2007 State Indicators are: Meeting or exceeding the goal of 75 percent proficient or above on: • Ohio Graduation Test (OGT) – 10th-grade: reading, mathematics, writing, science, social studies Meeting or exceeding the goal of 85 percent proficient or above on: • Ohio Graduation Test (OGT) – Cumulative 10th and 11th grade: reading, mathematics, writing, science, social studies Meeting or exceeding the 90 percent state requirement in: • Graduation Rate Meeting or exceeding the 93 percent state requirement in: • Attendance Rate On the each district or school report card you will see the total of State Indicators met plus a check mark (√) by each met indicator.
State Report Card(Component 2 – Performance Index . . .) • Performance Index - This measure looks at the achievement of every student, not just those who score proficient or higher. All achievement tests have five performance levels – advanced, accelerated, proficient, basic and limited. • A student score at the “advanced” level earns 1.2 points. • An “accelerated” score earns 1.1 points. • A “proficient” score earns 1.0 point. • A “basic” score earns 0.6 points. • A “limited” score earns 0.3 points. Students who are not tested receive zero points. Each weighted score is multiplied by the percentage of student scores at that level to generate a district’s or school’s Performance Index.
State Report Card(Component 3 - AYP . . .) • AYP (Adequate Yearly Progress) – AYP originated from the federal No Child Left Behind Act of 2001 and the Elementary and Secondary Education Act. The idea is to measure achievement across groups so none are “left behind.” • There are 10 student groups evaluated for AYP goals in reading and mathematics for the 2007-2008 school year in every school or district where at least 30 tested students (aggregated across all tested grades) are in that group. Student groups are: All Students, Black (Non-Hispanic), Native American, Asian/Pacific Islander, Hispanic, Multi-Racial, White (Non-Hispanic), Economically Disadvantaged, Limited English Proficient, Students with Disabilities. • To meet AYP, every school and district must test at least 95 percent of the students enrolled at the time state tests are given. Additionally, every school and district must test at least 95 percent of their students in each of the above 10 groups.
State Report Card(Component 3 – AYP - continued . . .) • Districts can meet AYP in one of four ways (see ODE Handbook). • AYP graduation and attendance goals are evaluated for schools and districts, but not each student group. Failure to meet any of the proficiency or participation goals, attendance levels or graduation targets results in the district or school missing AYP. AYP is “scored” MET or NOT MET. Consequences: • Ohio law states that a district or school that meets AYP can be designated no lower than Continuous Improvement. • Additionally, the law states that a district or school that does not meet AYP goals for three consecutive years, and has more than one of the 10 student groups not meeting AYP in the most recent year, can be rated no higher than Continuous Improvement. • What happens when schools/districts do not meet Adequate Yearly Progress and enter School/District Improvement Status? See Guidebook once again.
State Report Card(component 4 – Value Added . . .) • Value-added (prior to 2008 Ohio used what was called Performance Index Growth) – focus on the school’s contribution to making a difference. Value-added results are calculated for schools with grades 4-8 in reading and mathematics. Additionally, a composite result will be displayed on the front of the report card. The composite impacts the district’s or school’s rating. Results will be displayed using the following symbols: • ( + ) A plus symbol indicates that a district or school has achieved more than one year of expected growth in student progress. • ( √ )A check symbol indicates that a district or school has achieved one year of expected growth in student progress. • ( - ) A minus symbol indicates that a district or school has achieved less than one year of expected growth in student progress.
State Report Card(component 4 – Value Added - continued . . .) Consequences: • A district or school that achieves, on the composite result, an “Above Expected Growth” for two consecutive years may increase its rating by one category. For instance, a school otherwise rated as Effective may be raised to Excellent if it achieves a “+” designation for two consecutive years. • Beginning with the 2008-2009 report cards, districts and schools that show “Below Expected Growth” for three consecutive years will have their designation reduced.
Ohio School Performance Designations. . . Part II WHEW! Now that we know and understand the four components of the Ohio System, we can explore how these four areas come together to produce school and district report card designations: excellent with distinction, excellent, effective, continuous improvement, academic watch, or academic emergency. • See flow chart, page 8, in the “Guide for Ohio’s Report Card System.” (this PDF document is on the class website)
On your own, two ways you might continue . . .To Explore Ohio Report Cards • The Interactive Local Report Card (iLRC) was developed to provide public access to current and historical Local Report Card data. You will be able to locate information about test results, graduation rates, financial data, and demographics. You can sort and create reports to compare results across districts. • Website: http://ilrc.ode.state.oh.us/ • Find box “Power Unit Reports” – click on GO • Scroll Down to Bottom of page; click on BEGIN • Measure Up is a stand-alone application that can be downloaded free. It is designed for school leaders to facilitate understanding and analysis of report card data. The graphic format creates visual displays that are easily interpreted and shared (the camera icon can be used to cut and paste information into Power Point presentations). Links are provided to explanations about Report Card terminology. Key questions are provided for analyzing each level of data. • Website: http://www.ohioschoolleaders.org/ • Click on Measure Up Data Tool link and download
But how might you connect instruction to the State Assessment System . . . • The following two sites contain useful information regarding the Ohio Report Card and connecting information you teach to accountability standards. There are a number of other sites, but I like these: • D3A2 - Data Driven Decisions for Academic Achievement • Ohio Graduation Tests • Let’s look at each of these in more detail. By the way, is this teaching to the test? I think not. This exploration will help you prepare lessons in such a way as to impact the successful long term and short term achievements of your students . . . and your long term and short term effectiveness as a teacher.
D3A2 - Data Driven Decisions for Academic Achievement • D3A2 provides systemic access to educational resources aligned to Ohio's Academic Content Standards and can connect this to your own district’s student achievement data. Their goal is to “improve instruction and raise student achievement.” • Resources (including videos, lesson plans and assessments) are made available online, free of charge, by Ohio content providers who have agreed to rigorous development, review and alignment policies. Organizations providing content include: Columbus Zoo; COSI (Center of Science & Industry); Northern Ohio Educational Computer Association; Northwest Ohio Educational Technology; ODE; Ohio Historical Society/Ohio Social Studies Resource Center; Ohio Resource Center for Mathematics, Science and Reading; WNEO PBS 45/49; WVIZ Ideastream; CET; WGTE; and WPTD Think TV. • To search for resources aligned to specific benchmarks and grade level indicators in the academic content standards, log into www.d3a2.org and click the link to the Resource Exchange on the front page. No password is needed to access resources. Your school district would need to provide a password to access the data which would enable student connection.
Ohio Graduation Tests • The link below will take you to an interesting website section. Here we find a starting point for building tools that can help in understanding Ohio’s statewide assessments for the Ohio Graduation Tests (OGT). Website: http://reports.success-ode-state-oh-us.info/ • On that page, find the “Ohio Graduation Tests” section • Click on the “OGT Success Site” link inside this section • Find and click on the “Teacher Tools” section on this new page • From the next page, you can • build practice tests • see released questions • practice scoring constructed response questions • ZOWEE . . . Would telling a hiring official that you know about and intend to use this tool in creating assessments be useful or WHAT!
Practical Advice • Have an understanding of the ODE Ohio Report Card system and where your teaching assignment fits into this system. • Strive to support your school’s and district’s achievement of top designations in the ODE system. • Strive to teach and assess the things you know to be important that are NOT considered in the Ohio Accountability System. • Strive to recognize and create a classroom learning environment wherein the issue is not “either/or” in terms of assessment techniques.
Terms Concepts to Review andStudy on Your Own • Academic Emergency • Academic Watch • AYP • Continuous Improvement • Effective • Excellent with Distinction • Excellent • OGT • Ohio Report Card • Performance Index • State Indicators • Value Added