Download
1 / 29
290 likes | 415 Views
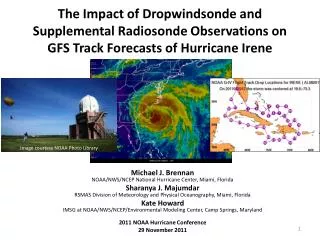
Applications of Ensemble Tropical Cyclone Products to National Hurricane Center Forecasts and Warnings. Mark DeMaria , NOAA/NESDIS/STAR, Ft. Collins, CO Michael J. Brennan , NOAA/NWS/NHC, Miami, FL Andrea Schumacher , CIRA/CSU, Ft. Collins, CO Kate Musgrave , CIRA/CSU, Ft. Collins, CO

E N D
Applications of Ensemble Tropical Cyclone Products to National Hurricane Center Forecasts and Warnings Mark DeMaria, NOAA/NESDIS/STAR, Ft. Collins, CO Michael J. Brennan, NOAA/NWS/NHC, Miami, FL Andrea Schumacher, CIRA/CSU, Ft. Collins, CO Kate Musgrave, CIRA/CSU, Ft. Collins, CO Timothy Marchok, NOAA/GFDL, Princeton, NJ Jon Moskaitis, Naval Research Laboratory, Monterey, CA Warn-on-Forecast and High Impact Weather Workshop 8-9 Feb 2012, Norman, OK
Outline • Use of satellite data in tropical cyclone forecast models • Use of model ensembles in tropical cyclone forecasting • Summary of NHC probabilistic products • Prototype probabilistic forecast tools for NHC • Ensemble statistical intensity models • Genesis probabilities from global models • Regional model ensembles • Hybrid statistical-dynamical model for wind speed probabilities • Application to hurricane warnings • Summary
Satellite Data in Tropical Cyclone Models • Global models • Assimilation of satellite radiances and derived products (feature track winds) • Good for track and structure, but not max winds • Regional models • Input through global model on outer mesh • TC initial location and intensity estimates • Intensity forecasts of limited quality • Statistical intensity models • GOES imagery, satellite altimetry used as predictors • Lightning data being tested under GOES-R3 • LEO input being tested under JHT and JPSS programs
Statistical Intensity Models IR Brightness Temperatures and Lightning Locations for Hurricane Celia (2010) 2007-11 NHC Atlantic Operational Intensity Model Errors Input from GOES and other sources can be used directly as predictors in SHIPS/LGEM HWRF, GFDL are regional coupled ocean/atmosphere models DSHIPS, LGEM are statistical models
Utilization of Ensembles in Tropical Cyclone Forecasting • Hurricane impacts extend beyond landfall point of the storm center • De-emphasize “skinny black line” in hurricane products • Users need deterministic forecast and measure of uncertainty • Strike probabilities introduced in 1983 • Generalized to wind speed probabilities in 2006 • Ensembles can provide quantitative measures of forecast uncertainty • Ensemble mean can be more accurate than single deterministic forecast
Probabilistic NHC Products:Probabilistic Tropical Cyclone Genesis Forecasts • NHC began issuing categorical 48-h genesis probability forecasts in the Tropical Weather Outlook in 2008 – specific probabilities included beginning in 2010 • Probability of tropical cyclone formation in the next 48 hours given for individual disturbances in 10% increments in the following categories: • Low: < 30% • Medium: 30–50% • High: > 50% • Based on analysis of current state of the atmosphere, satellite imagery, and model output 2. SHOWERS AND THUNDERSTORMS ASSOCIATED WITH AN ELONGATED AREA OF LOW PRESSURE LOCATED BETWEEN THE WEST COAST OF AFRICA AND THE CAPE VERDE ISLANDS HAVE CHANGED LITTLE THIS EVENING. ENVIRONMENTAL CONDITIONS ARE MARGINALLY CONDUCIVE FOR SOME SLOW DEVELOPMENT DURING THE NEXT COUPLE OF DAYS. THERE IS A MEDIUM CHANCE...30 PERCENT...OF THIS SYSTEM BECOMING A TROPICAL CYCLONE DURING THE NEXT 48 HOURS AS IT MOVES NORTHWESTWARD NEAR 10 MPH.
Probabilistic NHC Products (cont…) Wind Speed and Intensity Probability Products • Wind Speed Probabilities depict location-specific probabilities for 34-kt (tropical-storm-force), 50-kt (58-mph), and 64-kt (hurricane-force) winds • Text product shows cumulative and onset probabilities for a fixed set of locations • Graphic shows cumulative probabilities for points over a large domain • Intensity Probability Table shows the probability of tropical cyclone intensity (maximum wind) falling into various categories • Both are created using 1,000 Monte Carlo realizations • Random sampling of NHC track and intensity forecast errors from the previous 5 years • Centered on official NHC forecast • Errors are serially correlated • Model track spread has some influence on error sampling • Uses climatology and persistence model for wind radii • Accounts for decay over land
Probabilistic NHC Products (cont…) Probabilistic Storm Surge • Based on an ensemble of SLOSH model runs centered around the official NHC forecast • Creates alternate scenarios based on previous NHC Along and across track errors and intensity forecast errors • Varies radius of maximum wind in parametric wind model • Run when hurricane watch or warning in effect for the U.S. • Output includes: • Probabilities of storm surge exceeding thresholds from 2-25 ft • Exceedence height for various probability threshold (e.g., the surge height that has a 10% chance of being exceeded)
Experimental Probabilistic Tropical Cyclone Forecast Products • Ensemble statistical intensity models • Hurricane Forecast Improvement Project (HFIP) and GOES-R3 • Genesis probabilities from global models • HFIP • Regional model ensemble products • HFIP • Hybrid statistical-dynamical model for wind speed probabilities • HFIP and Joint Hurricane Testbed (JHT)
1. SPICE (Statistical Prediction of Intensity from a Consensus Ensemble) Model Configuration for Consensus SPICE forecasts TC intensity using a combination of parameters from: Current TC intensity and trend Current TC GOES IR TC track and large-scale environment from GFS, GFDL, and HWRF models These parameters are used to run DSHIPS and LGEM based off each dynamical model The forecasts are combined into two unweighted consensus forecasts, one each for DSHIPS and LGEM The two consensus are combined into the weighted SPC3 forecast
1. SPICE (Statistical Prediction of Intensity from a Consensus Ensemble) Model Configuration for Consensus DSHIPS and LGEM Weights for Consensus • Determined empirically from 2008-2010 sampleAtlantic and East Pacific
1. SPICE Skill (2011 Atlantic Season) Skill Relative to SHIFOR Number of Cases (304) (301) (263) (225) (192) (150) (116) (92)
2. TC genesis probabilities using a consensus of global ensemble models False Alarm Pre-Ophelia Pre-Philippe Pre-Hilary GFS, CMC, ECMWF, FNMOC ensembles (one model or multi-model) A vortex tracker is used to detect genesis in global ensemble forecast members. Probability is simply the percentage of members indicating genesis in a given lead time window (here, 0-24h).
3. Regional ensemble track product prototype • Loop over forecast lead time • Show track for ensemble mean only • Markers show ensemble mean and • ensemble member positions at • each lead time • Ellipses contain 2/3 of ensemble • member positions (black for • current lead time, gray for all • previous lead times) • Number of members specified for • each lead time Ellipse containing 2/3 of ensemble members at the current time Ellipses for all previous lead times
3. Regional ensemble track product prototype • Loop over forecast lead time • Show track for ensemble mean only • Markers show ensemble mean and • ensemble member positions at • each lead time • Ellipses contain 2/3 of ensemble • member positions (black for • current lead time, gray for all • previous lead times) • Number of members specified for • each lead time Ellipse containing 2/3 of ensemble members at the current time Ellipses for all previous lead times
3. Regional ensemble track product prototype • Loop over forecast lead time • Show track for ensemble mean only • Markers show ensemble mean and • ensemble member positions at • each lead time • Ellipses contain 2/3 of ensemble • member positions (black for • current lead time, gray for all • previous lead times) • Number of members specified for • each lead time Ellipse containing 2/3 of ensemble members at the current time Ellipses for all previous lead times
3. Regional ensemble track product prototype • Loop over forecast lead time • Show track for ensemble mean only • Markers show ensemble mean and • ensemble member positions at • each lead time • Ellipses contain 2/3 of ensemble • member positions (black for • current lead time, gray for all • previous lead times) • Number of members specified for • each lead time Ellipse containing 2/3 of ensemble members at the current time Ellipses for all previous lead times
3. Regional ensemble track product prototype • Loop over forecast lead time • Show track for ensemble mean only • Markers show ensemble mean and • ensemble member positions at • each lead time • Ellipses contain 2/3 of ensemble • member positions (black for • current lead time, gray for all • previous lead times) • Number of members specified for • each lead time Ellipse containing 2/3 of ensemble members at the current time Ellipses for all previous lead times
3. Regional ensemble track product prototype • Loop over forecast lead time • Show track for ensemble mean only • Markers show ensemble mean and • ensemble member positions at • each lead time • Ellipses contain 2/3 of ensemble • member positions (black for • current lead time, gray for all • previous lead times) • Number of members specified for • each lead time Ellipse containing 2/3 of ensemble members at the current time Ellipses for all previous lead times
3. Regional ensemble track product prototype • Loop over forecast lead time • Show track for ensemble mean only • Markers show ensemble mean and • ensemble member positions at • each lead time • Ellipses contain 2/3 of ensemble • member positions (black for • current lead time, gray for all • previous lead times) • Number of members specified for • each lead time Ellipse containing 2/3 of ensemble members at the current time Ellipses for all previous lead times
3. Regional ensemble track product prototype • Loop over forecast lead time • Show track for ensemble mean only • Markers show ensemble mean and • ensemble member positions at • each lead time • Ellipses contain 2/3 of ensemble • member positions (black for • current lead time, gray for all • previous lead times) • Number of members specified for • each lead time Ellipse containing 2/3 of ensemble members at the current time Ellipses for all previous lead times
3. Regional ensemble track product prototype • Loop over forecast lead time • Show track for ensemble mean only • Markers show ensemble mean and • ensemble member positions at • each lead time • Ellipses contain 2/3 of ensemble • member positions (black for • current lead time, gray for all • previous lead times) • Number of members specified for • each lead time Ellipse containing 2/3 of ensemble members at the current time Ellipses for all previous lead times
3. Regional ensemble track product prototype • Loop over forecast lead time • Show track for ensemble mean only • Markers show ensemble mean and • ensemble member positions at • each lead time • Ellipses contain 2/3 of ensemble • member positions (black for • current lead time, gray for all • previous lead times) • Number of members specified for • each lead time Ellipse containing 2/3 of ensemble members at the current time Ellipses for all previous lead times
3. Regional ensemble track product prototype • Loop over forecast lead time • Show track for ensemble mean only • Markers show ensemble mean and • ensemble member positions at • each lead time • Ellipses contain 2/3 of ensemble • member positions (black for • current lead time, gray for all • previous lead times) • Number of members specified for • each lead time Ellipse containing 2/3 of ensemble members at the current time Ellipses for all previous lead times
3. Regional ensemble intensity & wind radii product prototypes • Box plot for each lead time • Box plot shows the extrema and various quantiles of the ensemble intensity • distribution
4. Hybrid Statistical-Dynamical Wind Speed Probabilities • Statistical method: 1000 realizations from random sampling NHC track and intensity error distributions from last 5 years • Replace realization tracks with values from global model ensembles • GFS, CMC, and ECMWF global ensembles used 1000 Track Realizations 64 kt 0-120 h Cumulative Probabilities
4. Hybrid Statistical-Dynamical WSPExample: Earl 2011 Probabilities Realizations MCP MCP MCP Hybrid w/ ensemble tracks (N=93) MCP Hybrid w/ ensemble tracks (N=93) Verification shows Hybrid MCP has more skill at longer lead times
Applying Probabilistic Forecasts to Hurricane Warnings • HuLPA (Hurricane Landfall Probability Applications) • Statistical relationship between wind speed probabilities and timing/location hurricane warnings • Improvements to probabilities improvements to watches & warnings
Summary • Tropical cyclone products include deterministic products and measures of uncertainty • Ensembles can provide quantitative measures of uncertainty and ensemble mean forecast • Statistical intensity forecasts currently outperform coupled/ocean atmosphere models • Direct inclusion of satellite information more straightforward • SPICE model provided additional improvement to statistical intensity forecasts • Other ensemble based products under development • Wind speed probabilities can provide objective guidance for hurricane watches and warnings