Download
1 / 31
310 likes | 408 Views
South Pole Ice model. http://icecube.wisc.edu/~dima/work/WISC/ppc/spice/. Dmitry Chirkin, UW, Madison. IceCube in-ice calibration devices. 3 Standard candles 56880 Flashers 7 dust logs. Flasher dataset. Simulation. For muons: folded with Cherenkov spectrum. Flasher 405 nm.

E N D
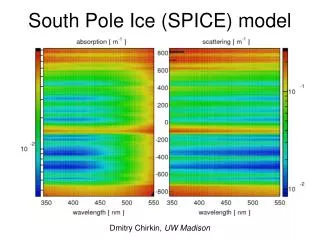
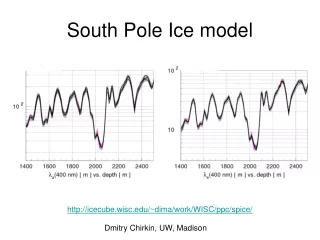
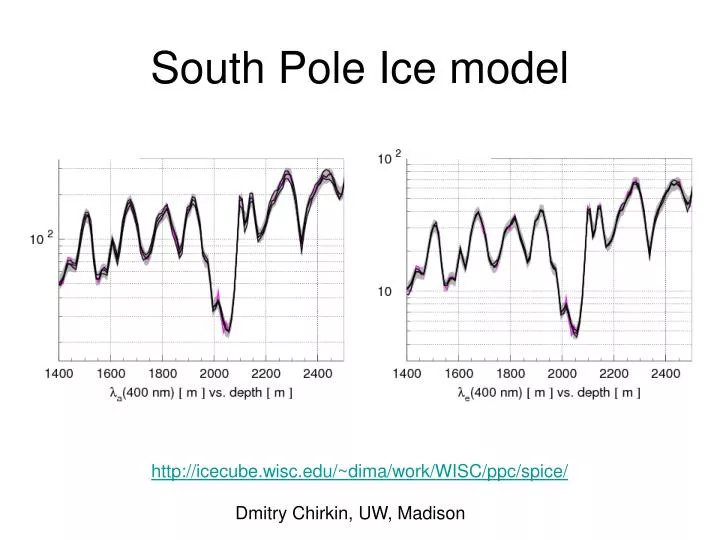
South Pole Ice model http://icecube.wisc.edu/~dima/work/WISC/ppc/spice/ Dmitry Chirkin, UW, Madison
IceCube in-ice calibration devices 3 Standard candles 56880 Flashers 7 dust logs
Simulation For muons: folded with Cherenkov spectrum Flasher 405 nm Sample Cherenkov photons from this curve Angular sensitivity
Fitting the data 10 events 4 events 1 event simulated • Absolute calibration of average flasher is obtained “for free” • no need to know absolute flasher light output beforehand • no need to know absolute DOM sensitivity 2.1 3.1 Red: AHA Black: SPICE
Likelihood description of data Sum over emitters, receivers, time bins in receiver Find expectations for data and simulation by minimizing –log of Measured in simulation: s and in data: d; ns and nd: number of simulated and data flasher events Regularization terms:
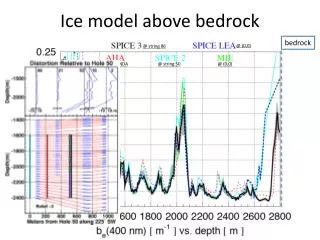
Correlation with dust logger data (from Ryan Bay) effective scattering coefficient Scaling to the location of hole 50 fitted detector region
Refining the solution 7% in a 1% in be
Possible reasons for this discrepancy • flasher directionality was ignored: cylindrical symmetry of the 6-flasher emission pattern was assumed • checked: simulating flashers with measured directions (6-prong star pattern) reproduces the above result exactly • effects of the hole ice on photon propagation were taken only through the angular sensitivity curve • however: resulting ice properties are the same (within uncertainties) for either nominal or hole ice angular sensitivity • various issues in recorded waveforms: effects of saturation and undershoot, miscalibration, etc. • already: using the saturation correction. • Fine structure of ice layers matters? under investigation
History of changes 11/19/09 SPICE (also known as SPICE1): first version * seeded with AHA as initial solution * AHA is used for extrapolation above and below the detector * relies on AHA for correlation relation between be(400) and adust(400). 02/01/10 SPICE2: * fixed the hdh bug (see ppc readme file) * seeded with bulk ice as initial solution * dust logger and EDML data is used for extrapolation * dust logger data is used to extend in x and y, taking into account layer tilt. 02/17/10 SPICE2+: * fixed the "x*y" option hit counting in ppc * be(400) vs. adust(400) relation is determined with a global fit to arrival time distributions. 04/28/10 SPICE2x (this page): * improved charge extraction in data: improved merging of the FADC and ATWD charges implemented saturation correction fixed the alternating ATWD bug * updated DOM radius 17.8 --> 16.51 cm (cosmetic change: modifies only the meaning of py) * fixed the DOM angular sensitivity curve (removed upturn at cos(q)=-1).
SPICE models py=3.1 py=2.1
Ratio to SPICE2x 7% uncertainty 5% uncertainty py=2.1 py=3.1
Why does AHA not work? Individually fitted for each pair: best possible fit Points at same depth not consistent with each other! Fits systematically off
Why does AHA not work? When replaced with the average, the data/simulation agreement will not be as good From ice paper Averaged scattering and absorption Measured properties not consistent with the average! Deconvolving procedure is unaware of this and is using the averages as input
SPICE vs. AHA: horizontal flashers SPICE AHA
SPICE vs. AHA: 45 degree flashers SPICE AHA
Single muons generated with mmc SPICE AHA
Muon bundles generated with corsika SPICE AHA
Improvement in simulation by Anne Schukraft by Sean Grullon Downward-going CORSIKA simulation Up-going muon neutrino simulation
Unfolded data with only events in the top or bottom preliminary preliminary IC-22 atmospheric neutrino analysis
IC-22 unfolding result preliminary • Despite problems in detector simulation, agreement with Bartol muon neutrino flux was demonstrated • It was decided that the simulation, namely simulation of the ice, needed improvement before this analysis can proceed to claiming a measurement of the neutrino flux. • This problem has been solved! • redo the analysis (with IC-40)
Conclusions and outlook • SPICE (South Pole ICE) model: • fitted to IceCube flasher data collected on string 63 • demonstrated remarkable correlation with the dust logger data • therefore was extended to incorporate these data (SPICE2) • uses flasher timing information (since SPICE2+) • Rapid progress in simulation leads to very good agreement with data: • In-situ flasher simulation • background muon simulation • neutrino simulation • Uncertainties on the model are ~ 5% on scattering and ~ 7% absorption • Need to understand remaining ~ 7% disagreement between timing and amplitude distributions • Future: measure the wavelength dependence with the standard candle