Download
1 / 1
10 likes | 127 Views
South Pole Neutron Monitor Lives Again. SH4.5 622. PAUL EVENSON 1 , JOHN BIEBER 1 , JOHN CLEM 1 , ROGER PYLE 2 1 University of Delaware Department of Physics and Astronomy 2 Pyle Consulting Group.

E N D
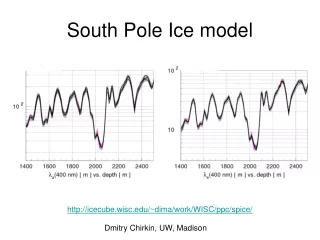
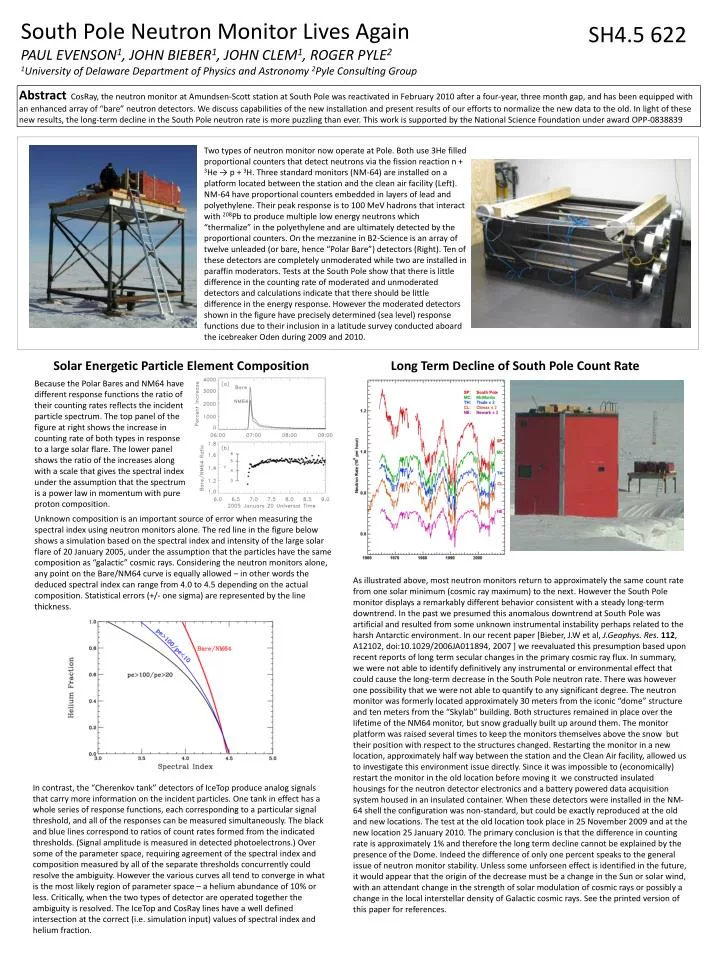
South Pole Neutron Monitor Lives Again SH4.5 622 PAUL EVENSON1, JOHN BIEBER1, JOHN CLEM1, ROGER PYLE2 1University of Delaware Department of Physics and Astronomy 2Pyle Consulting Group Abstract CosRay, the neutron monitor at Amundsen-Scott station at South Pole was reactivated in February 2010 after a four-year, three month gap, and has been equipped with an enhanced array of “bare” neutron detectors. We discuss capabilities of the new installation and present results of our efforts to normalize the new data to the old. In light of these new results, the long-term decline in the South Pole neutron rate is more puzzling than ever. This work is supported by the National Science Foundation under award OPP-0838839 Two types of neutron monitor now operate at Pole. Both use 3He filled proportional counters that detect neutrons via the fission reaction n + 3He → p + 3H. Three standard monitors (NM-64) are installed on a platform located between the station and the clean air facility (Left). NM-64 have proportional counters embedded in layers of lead and polyethylene. Their peak response is to 100 MeV hadrons that interact with 208Pb to produce multiple low energy neutrons which “thermalize” in the polyethylene and are ultimately detected by the proportional counters. On the mezzanine in B2-Science is an array of twelve unleaded (or bare, hence “Polar Bare”) detectors (Right). Ten of these detectors are completely unmoderated while two are installed in paraffin moderators. Tests at the South Pole show that there is little difference in the counting rate of moderated and unmoderated detectors and calculations indicate that there should be little difference in the energy response. However the moderated detectors shown in the figure have precisely determined (sea level) response functions due to their inclusion in a latitude survey conducted aboard the icebreaker Oden during 2009 and 2010. Solar Energetic Particle Element Composition Long Term Decline of South Pole Count Rate Because the Polar Bares and NM64 have different response functions the ratio of their counting rates reflects the incident particle spectrum. The top panel of the figure at right shows the increase in counting rate of both types in response to a large solar flare. The lower panel shows the ratio of the increases along with a scale that gives the spectral index under the assumption that the spectrum is a power law in momentum with pure proton composition. Unknown composition is an important source of error when measuring the spectral index using neutron monitors alone. The red line in the figure below shows a simulation based on the spectral index and intensity of the large solar flare of 20 January 2005, under the assumption that the particles have the same composition as “galactic” cosmic rays. Considering the neutron monitors alone, any point on the Bare/NM64 curve is equally allowed – in other words the deduced spectral index can range from 4.0 to 4.5 depending on the actual composition. Statistical errors (+/- one sigma) are represented by the line thickness. As illustrated above, most neutron monitors return to approximately the same count rate from one solar minimum (cosmic ray maximum) to the next. However the South Pole monitor displays a remarkably different behavior consistent with a steady long-term downtrend. In the past we presumed this anomalous downtrend at South Pole was artificial and resulted from some unknown instrumental instability perhaps related to the harsh Antarctic environment. In our recent paper [Bieber, J.W et al, J.Geophys. Res. 112, A12102, doi:10.1029/2006JA011894, 2007 ] we reevaluated this presumption based upon recent reports of long term secular changes in the primary cosmic ray flux. In summary, we were not able to identify definitively any instrumental or environmental effect that could cause the long-term decrease in the South Pole neutron rate. There was however one possibility that we were not able to quantify to any significant degree. The neutron monitor was formerly located approximately 30 meters from the iconic “dome” structure and ten meters from the “Skylab” building. Both structures remained in place over the lifetime of the NM64 monitor, but snow gradually built up around them. The monitor platform was raised several times to keep the monitors themselves above the snow but their position with respect to the structures changed. Restarting the monitor in a new location, approximately half way between the station and the Clean Air facility, allowed us to investigate this environment issue directly. Since it was impossible to (economically) restart the monitor in the old location before moving it we constructed insulated housings for the neutron detector electronics and a battery powered data acquisition system housed in an insulated container. When these detectors were installed in the NM-64 shell the configuration was non-standard, but could be exactly reproduced at the old and new locations. The test at the old location took place in 25 November 2009 and at the new location 25 January 2010. The primary conclusion is that the difference in counting rate is approximately 1% and therefore the long term decline cannot be explained by the presence of the Dome. Indeed the difference of only one percent speaks to the general issue of neutron monitor stability. Unless some unforseen effect is identified in the future, it would appear that the origin of the decrease must be a change in the Sun or solar wind, with an attendant change in the strength of solar modulation of cosmic rays or possibly a change in the local interstellar density of Galactic cosmic rays. See the printed version of this paper for references. In contrast, the “Cherenkov tank” detectors of IceTop produce analog signals that carry more information on the incident particles. One tank in effect has a whole series of response functions, each corresponding to a particular signal threshold, and all of the responses can be measured simultaneously. The black and blue lines correspond to ratios of count rates formed from the indicated thresholds. (Signal amplitude is measured in detected photoelectrons.) Over some of the parameter space, requiring agreement of the spectral index and composition measured by all of the separate thresholds concurrently could resolve the ambiguity. However the various curves all tend to converge in what is the most likely region of parameter space – a helium abundance of 10% or less. Critically, when the two types of detector are operated together the ambiguity is resolved. The IceTop and CosRay lines have a well defined intersection at the correct (i.e. simulation input) values of spectral index and helium fraction.