Download
1 / 63
630 likes | 636 Views
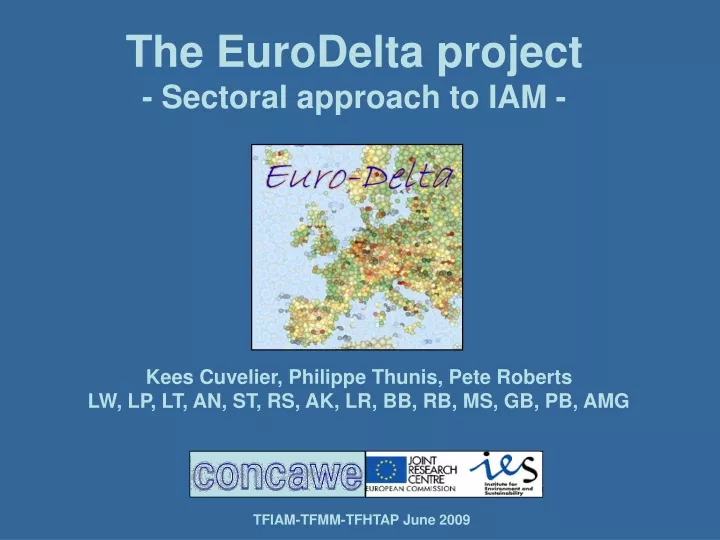
The EuroDelta project - Sectoral approach to IAM -. Kees Cuvelier, Philippe Thunis, Pete Roberts LW, LP, LT, AN, ST, RS, AK, LR, BB, RB, MS, GB, PB, AMG. TFIAM-TFMM-TFHTAP June 2009. EuroDelta.

E N D
The EuroDelta project - Sectoral approach to IAM - Kees Cuvelier, Philippe Thunis, Pete Roberts LW, LP, LT, AN, ST, RS, AK, LR, BB, RB, MS, GB, PB, AMG TFIAM-TFMM-TFHTAP June 2009
EuroDelta • Inter-comparison exercise involving some important models used for AQ policy applications in Europe. • Several Phases of work • Model Comparison with Data (validation, performance) • Model Comparison with Model (understand formulation effects) • Model Scenario studies (response to changes in input) • Model zooming studies (response on different scale) • Coordinated (inputs and outputs) by JRC Ispra • Preparation of input data • Common system of managing results • Pictorial display of information • Data processing for detailed outputs.
ED Participants • Models common to all phases: • CHIMERE • EMEP • LOTOS • MATCH • REM/CALGRID • Participants • JRC-Ispra (EC) • CONCAWE (B) • INERIS (F) - CHIMERE • MET.no (N) - EMEP • TNO (NL) - LOTOS • SMHI (S) - MATCH • FUB (G) - REM/CALGRID
ED phase I (2003-2006) • Examined the performance of Regional AQ models in predicting: • recent (2000; for validation) and • future (2020) AQ in Europe • Used 1999 and 2001 Meteorology to test sensitivity • Same input data (emission inventory) • Different meteorological drivers, grids and domains.
ED phase I (2003-2006) cont’ • Investigation of 2020 emission reductions for • NOx, SO2, VOC, NH3, PPM2.5 independently in three countries: • FR, DE, IT • NOx and SOx in sea areas • North Sea, Med. Sea • Emission reductions applied proportionately across SNAP-sectors. • Calculated Source Receptor Relationships (SRR) • Country to Country • Country to Europe (EU26, EUall)
Phase I Results • Model inter-comparison (model to data and model to model) was very informative and scientifically rewarding. • Model developments • insights into several aspects of model performance. • Learning points on standardisation of input data. • SRR comparison was a “first” • Ensemble approach • Spread of ensemble indicates degree of consistency between models ~ measure of ‘uncertainty’ • Proximity of model to centre of ensemble indicates degree of bias.
Emission reductions • The emission reductions are distributed over all SNAP sectors in proportion to their contribution. • This type of SRR (Country => Grid => Country/EU) is used in the IIASA/RAINS approach to Integrated Assessment (IA) for the Protocol.
ED Phase II (2006-) • Main objective: to study if reducing emissions from individual sectors produced the same SRR as a proportional reduction across all sectors. • Stimulated by questions about large point source treatments in models (source heights vs model vertical structure) • International shipping as a sector open to control • Recognition (City Delta) that some sectors may be more important than others requiring ‘uplift’ of PM concentrations in grid squares with significant urban area. • Proximity of Sources and Populations • Clearly it is computationally impossible to have full sectoral SRRs in IAM so • First look to see if there was any effect • Second look to see if sectors could be grouped and make the computational process more tractable.
ED Phase II (2006-) con’t • Run in two tranches • Tranche 1 • Explored results for GB, FR, ES, DE • Med. Sea Scenarios • Published EUR 23444 EN – 2008 • Tranche 2 • PL, IT, Benelux, Po Valley • North Sea, Baltic Sea and Atlantic • Added some finer resolution studies for Marseilles and Piraeus • Total of 80 land-based and 15 sea-based scenarios
Presentation of Results • Each calculation involves an emission reduction in a country. • EuroDelta tool is used to calculate the consequential difference in [say] concentration at each domain grid square: • SRR: Country => Country • SRR: Country => EU • This difference can be population weighted if needed. • Emission reductions are done: • on a sector basis • on a proportional basis across sectors • Emission reductions compared using an effectiveness parameter
Example Scenario (France input data) • To simplify modelling and reduce number of runs • NOx and PPM2.5 reductions modelled together • SO2 and VOC modelled together • Scenarios • ALL scenario • National Emission Reductions applied across all sectors (proportional to inventory) • SECTOR scenario • Emission reduction to sector only • COMBINED • Selected sectors run together • Sum of emission reductions is the same for ALL and COMBINED
Effectiveness of Emission Reduction for (population weighted) PM2.5 EER = Pollutant reduction / kt. of pollutant abated = Δ Concentration*POP / Δ Emission Relative effectiveness (RE) : = Single Sector EER / ALL sector EER RE of PPM2.5 reduction on PM2.5 for EMEP model
Relative Effectiveness of PPM2.5 reduction on PM2.5 (EMEP model)
Summary for PPM2.5 reduction on PM2.5 • Results • Reducing emission on Sector 1 is less effective than reducing ALL • Reducing emission on Sector 3 is less effective than reducing ALL • Reducing emission on Sector 7 is more effective than reducing ALL • Reducing emission on Sectors 2 and 4 is mixed • Significance: • if IAM on basis of ALL modelling determines reduction of X is necessary but if implementation means that burden of reduction falls on Sector 1/3 then policy will underachieve. • If burden falls on Sector 7 then policy will over-achieve • Most effective policy likely to be one that accounts for the sectoral effect.
+ Other Countries and Models • Next slides show: • Graphic of data from table • Impacts in the different countries/regions (country=>country, =>EU26, => EUall) • Predictions of the individual models asbars – denoting range, EMEP as cross • Single Sector • First attempts at grouping sectors
PM2.5 POP = 0 PPM2.5, SOx, NOx Absolute impact
PM2.5: POP = 0 1 PPM2.5, NOx
Country => EU26 POP=0 POP=1
YOLL: PPM2.5, SOx, NOx Absolute impact
Total Deposition: POP = 0 NOx, SOx, NHx
Conclusions • Some results of the EuroDelta project have been presented that show that there are important differences in the effectiveness of emission reductions between sectors. • Broadly speaking • Reducing emissions in sectors 1 and 3 has less effect than the ALL scenario in which national emissions are reduced proportionately. • Reducing emissions in sector 7 has more effect • For some sectors (2, 4) the effect can be less or more depending on country • Findings are consistent across models.
Recommendation ED-II • It is recommended that validation calculations are carried out as part of the Policy process to examine if the implied sectoral reductions are able to deliver the intended benefits. • If sectoral weights could be incorporated into the IA itself, then this may lead to : • Different emission ceilings for the same environmental • benefits • Different distribution of emission reductions per sector.
More information • The first phase of this work is reported and is available from JRC • http://aqm.jrc.it/eurodelta • Contact: • kees.cuvelier@jrc.it • philippe.thunis@jrc.it • Full model results will be published after the Summer. • More work to be done!
Referencies Vautard, Van Loon, Schaap, Bergstrom, Bessagnet, Brandt, Builtjes, Christensen, Cuvelier, Graff, Jonson, Krol, Langner, Roberts, Rouïl, Stern, Tarrason, Thunis, Vignati, White, Wind. Is regional air quality model diversity representative of uncertainty for ozone simulation? Geophysical Research Letters 2007 R Vautard, M. Schaap, R Bergström, B. Bessagnet, J. Brandt,P.J.H. Builtjes,J. H. Christensen, C. Cuvelier, V. Foltescu, A. Graf, A. Kerschbaumer, M. Krol, P. Roberts, L. Rouïl, R. Stern, L. Tarrason, P. Thunis, E. Vignati, P. Wind. Skill and uncertainty of a regional air quality model ensemble. Atmospheric Environment 2008 M. Schaap, R. Vautard, M. van Loon, R. Bergström, B. Bessagnet, L. Rouil, V. Foltescu, J. Langner, J. Brandt, J. Kristensen, E. Vignati, M. Krol, P.J.H. Builtjes, R. Stern, A. Graff, P. Wind, J.E. Jonson, L. Tarrasón, L. White, P. Roberts, C. Cuvelier, P. Thunis: Evaluation of long term aerosol simulations from seven regional air quality models and their ensemble in the EURODELTA study. Atmospheric Environment 2007 Van Loon, Vautard, Schaap, Bergstrom, Bessagnet, Brandt, Builtjes, Christensen, Cuvelier, Graff, Jonson, Krol, Langner, Roberts, Rouïl, Stern, Tarrason, Thunis, Vignati, White, Wind. Evaluation of long-term ozone simulations from seven regional air quality models and their ensemble. Atmospheric Environment 2007 Thunis P, Cuvelier C (editors), Roberts P, White L, Post L, Tarrason L, Tsyro S, Stern R, Kerschbaumer A, Rouil L, Bessagnet B, Bergström R, Schaap M, Boersen G, Boersen P,. EURODELTA II – Evaluation of a Sectoral Approach to Integrated Assessment Modelling Including the Mediterranean Sea. EUR 23444 EN. Luxembourg (Luxembourg): OPOCE; 2008. JRC41801
Future of EuroDelta • New phase of EuroDelta will start in autumn. • Involvement of more Modelling groups. • 50 km x 50 km => Finer scale => Zooming. • High resolution Int & Val, using HR emission inventories. • Vertical profiles. • Past-casting: 2004 => 2009 with 2009-models. • Int & Val, impact of meteo variability. • Organic aerosols – Int & Val of PM speciation • Biogenic emissions in relation to ozone and organics (natural VOCs) • Regional – Hemispheric integration (background, climate) • Data assimilation • Exposure • Southern Europe / Mediterranean • Application to the Ambient air-quality directive process (Ex: impact of (local) measures, change to biofuels,…)
Future of EuroDelta • New phase of EuroDelta will start in autumn. • Involvement of more Modelling groups. • 50 km x 50 km => Finer scale => Zooming. • High resolution Int & Val, using HR emission inventories. • Vertical profiles. • Past-casting: 2004 => 2009 with 2009-models. • Int & Val, impact of meteo variability. • Organic aerosols – Int & Val of PM speciation • Biogenic emissions in relation to ozone and organics (natural VOCs) • Regional – Hemispheric integration (background, climate) • Data assimilation • Exposure • Southern Europe / Mediterranean • Application to the Ambient air-quality directive process (Ex: impact of (local) measures, change to biofuels,…) • Policy-supporting AQ modelling activities
SNAP97 emission activity sectors: • The emission reductions are distributed over all SNAP sectors in proportion to their contribution. This type of SRR (Country => Grid => Country) is used in the IIASA/RAINS approach to Integrated Assessment (IA) for the CAFE programme.
Report ED II + 3 DVDs To receive a copy: Let me know
Conclusions ED II • Particulate matter • All models agree that there are differences in • effectiveness of emission reductions between sectors • The differences between sectors is greater for • population weighted compared with non-weighted • concentrations • True for C=>G=>C, and C=>G=>EU • The sectoral response is not the same in all countries • and is different for each pollutant • Ozone (SOMO35) • There are large country differences in the response of • SOMO35 to NOx reductions from different sectors • (same for VOC reductions) • SOMO35 is defined as the sum, over the year, of the maximum of the 8 hours daily means • over 35 ppb. [ppb*days]
Main Conclusion ED II The study has shown that there are important differences between sectors in the amount of concentration (deposition) reduction obtained by changing a pollutant emission. This difference is not accounted for in the present process used to evaluate future national emissions ceiling reductions for both beneficial effect and cost-effectiveness. This raises the possibility that, when national bodies consider how to implement an emission ceiling, choices might be made that are less effective than expected.
Effectiveness of Emission Reduction for population weighted PM2.5 EER = Pollutant reduction per kt. of pollutant abated = Δ Concentration*POP / Δ Emission Relative effectiveness (RE) : = Single Sector ERR / ALL sector ERR
Example Scenario (France input data) • To simplify modelling and reduce number of runs • NOx and PPM2.5 reductions modelled together • SO2 and VOC modelled together • Scenarios • ALL scenario • National Emission Reductions applied across all sectors (proportional to inventory) • SECTOR scenario • Emission reduction to sector only • COMBINED • Selected sectors run together • Sum of emission reductions is the same for ALL and COMBINED
ED Phase I (2003-2006) • Examination of common performance of Regional AQ • models in predicting recent (2000; for validation) and • future (2020) AQ in Europe for 1999/2001 Meteorology • AQ models: • CHIMERE (F), RCG-REM (G), EMEP, MATCH (S), • LOTOS (NL), TM5 (NL,Ispra) • Investigation of 2020 emission reductions for • NOx, SO2, VOC, NH3, PPM2.5 independently in • FR, GE, IT (Source-Receptor Relationships) • NOx and SOx in sea areas (NorthSea, MedSea). • The model Ensemble was used to measure robustness • of the predictions.
ED Phase II (2006-) • Study of the impact of emission reductions in individual • emission sectors. • First look at whether there are differences in the impact of • emission reductions if they are applied to single sectors • compared with all sectors. • Aims to assess the usefulness of introducing sectoral SRR • in IA. • Total of 80 scenarios for FR, SP, GE, UK, PL, IT, PV, BNL. • Total of 15 sea-scenarios for NorthSea, MedSea, zoom into • Marseille and Athens
Effectiveness measure of emission reduction = Pollutant reduction per kTon of pollutant abated = Δ Concentration*POP / Δ Emission Relative effectiveness = Eff.sector / Eff.All