Download
1 / 24
240 likes | 343 Views
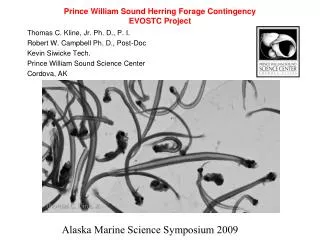
A Model for Early Life History Survival for Pacific Herring in Prince William Sound. Brenda Norcross, Seanbob Kelly, Peter-John Hulson, Terry Quinn School of Fisheries and Ocean Sciences University of Alaska Fairbanks. Herring – An Important Species. Forage fish. Commercial fishery.

E N D
A Model for Early Life History Survival for Pacific Herring in Prince William Sound Brenda Norcross, Seanbob Kelly, Peter-John Hulson, Terry Quinn School of Fisheries and Ocean Sciences University of Alaska Fairbanks
Herring – An Important Species • Forage fish • Commercial fishery
Prince William Sound http://marine.alaskapacific.edu/octopus/pws-map.php
Recent History of Herring • Fishery closed in March 1989 following the Exxon Valdez oil spill • Stock collapsed 1993 due to (VHSV) • Species has not recovered to pre-oil spill abundance
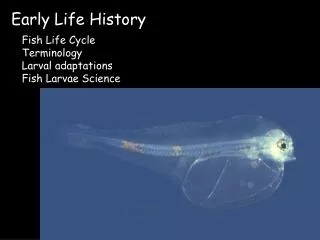
Spawning and Larvae • Herring spawn onshore in April • Larvae herring are advected counter-clockwise through open water
Years 1 and 2 • June-August metamorphosis • Nursery habitats at heads of bays • In nursery bays for 2 winters • Leave bays and join adult schools
Early Life History to Age-1 • 4 stages - eggs, larvae, fall juveniles, winter juveniles • Know mortality changes as life stage changes • Determine which life stage is most influential
Early Life History Model • Life-stage specific survival to age-1 • Builds on an earlier range-based study (Norcross & Brown 2001) • Statistical distributions of survival to account for uncertainty • Data input from published estimates
Standard Year-Class Model (Quinn and Deriso 1999) • Cumulative mortality - z for each stage multiplied by number of days per stage • Total mortality - combines mortalities of sequential life stages to age-1 ,
Delta Method (Seber 1982) • Converts standard error of survival to that of mortality • Assumed normal distribution • Allows determination of 95% confidence intervals .
Egg Stage - first 21 days • (Haegele 1993) • Subsurface oophagy - crabs, sea anemones, and snails • (Rooper et al. 1999) • Duration of air exposure - exposure abiotic forces, and avian predation
Larval Stage - next 92 days • (McGurk et al. 1993) • Larval mortality caused by advection, predation, and inability to feed • Data from Auke Bay, Southeast Alaska • Comparable to estimates from British Columbia
Fall Juvenile Stage - next 92 days • (Stokesbury et al. 2002) • Greatest mortality due to predation • Averaged over four bays and two years
Winter Juvenile Stage - next 135 days • (Patrick 2000) • Energy reserves (WBEC) and water temperature affect survival • Age-0 winter mortality due to starvation • Averaged over 12 bays
Egg Stage Larval Stage >Age-3 spawn hatch next 92 days mortality 0.07 d-1 first 21 days mortality 0.07 d-1 drift Winter Juvenile Stage Fall Juvenile Stage nursery bay Age-1 next 135 days mortality 0.004 d-1 next 92 days mortality 0.01 d-1
Results • Total survival through age-1 • 118 herring out of 1 million eggs • Compare to range-based – 1-6,500 • Consistent with the results of age-structured assessment (ASA)
Distribution of total mortality ASA (age-3) ELH (age-1) 0.4 0.35 0.3 Frequency 0.25 0.2 0.15 0.1 0.05 0 4 5 6 7 8 9 10 11 12 13 14 Total Mortality (Z) • Average ELH mortality is lower than ASA mortality • ASA incorporates mortality ages-0 through -3 • Greater uncertainty in the distribution of ELH mortality ASA ELH Total mortality
Single-Stage Sensitivity Analysis • Altered mortality of each life stage by 10% • Total survival was most affected by the larval stage • Length of stage (92 days) and mortality level (* 0.07 d-1) is cause • Other life stages had an order of magnitude less effect
Conclusions • Life stages did not contribute equally to mortality and survival • Larval stage has the largest influence on total survival • This model shows that there is high uncertainty in the early life history
Acknowledgments • Exxon Valdez Oil Spill Trustee Council • Jeep Rice • Mark Carls
Results of single-stage sensitivity analysis. Both of the textured series are the results from increasing (left) or decreasing (right) daily mortality (zi) while the black series is the total survival estimated from the base early life history (ELH) model
Interaction Sensitivity Analysis • Determined all possible paired combinations of life stages • Altered each pair of mortality estimates by 10% • Larval stage combined with any other life stage contributed the most to total survival • Total survival maximized by decreasing mortality for larval and egg stages