Download
1 / 32
320 likes | 409 Views
Nowcast/Forecast System of Prince William Sound, Alaska (PWS-NFS). INKWEON BANG CHRISTOPHER N.K. MOOERS OCEAN PREDICTION EXPERIMENTAL LABORATORY (OPEL) RSMAS, UNIVERSITY OF MIAMI MIAMI, FLORIDA, USA. Outline. Introduction PWS-NFS with NDBC Wind PWS-NFS with PWS-RAMS Wind

E N D
Nowcast/Forecast System of Prince William Sound, Alaska(PWS-NFS) INKWEON BANG CHRISTOPHER N.K. MOOERS OCEAN PREDICTION EXPERIMENTAL LABORATORY (OPEL) RSMAS, UNIVERSITY OF MIAMI MIAMI, FLORIDA, USA
Outline • Introduction • PWS-NFS with NDBC Wind • PWS-NFS with PWS-RAMS Wind • Process and Validation Studies • Challenges
Offshore Circulation L Aleutian Low Alaska Current (EBC) & Alaska Stream (WBC) Alaska Coastal Current
Prince William Sound Forcings Throughflow - ACC Wind - Aleutian Low Buoyancy - Snowmelt Tide Topography - Fjord
Barotropic – Flat Bottom Barotropic – Realistic Bottom
PWS-NFS Diagram Real-Time Observing System Historical Data Atmospheric Model Sub-Models • Wind, Heat Flux • Precipitation, SLP • Tide • Freshwater Flux •CTD, ADCP, etc •UAF, SEA,OSRI • Winds, SST, Sea Level • NDBC, NCEP, NOS • Forcing PWS-POM • Verification • Data assimilation Horizontal Maps Transects Time series Animations Current Temperature Salinity Particle trajectories Archives Web Ecosystem Model Fisheries Model OSCAR (chemical fates)
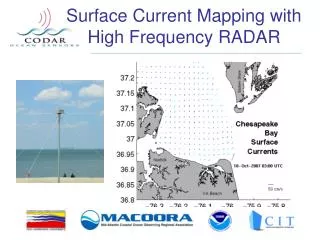
Model Domain and Locations of Observations by NDBC, NOS, PWSSC
Attributes of PWS-POM • North of HE & MS expand to NGOA (North of 59oN, 150oW ~ 145oW) • 0.01o 0.02o (~1.1 km) 15 levels more vertical levels (26 levels) • External timestep = 5 seconds, Internal timestep = 2.5 minutes • HORCON = 0.2, TPRNI=1.0 HORCON = 0.1, TPRNI=0.2 • Maximum depth = 500 m full depth • Climatological T/S at open boundary from a larger domain model (Global NCOM) • Radiation boundary condition at open boundary • Mellor-Yamada 2.5 vertical turbulence closure scheme • Smagorinsky horizontal turbulence closure scheme
Attributes of PWS-NFS • Since November 2000 • Hourly wind (NDBC 46060) high-resolution (4 km) regional atmospheric forecast model (PWS-RAMS) • 8 Tidal constituents (O1,K1,P1,Q1,M2,S2,N2,K2) plus ACC transport • Monthly heat flux (COADS) PWS-RAMS • Daily, non-uniform climatological freshwater flux (hydrological model) forecast from hydrological sub-model and/or PWS-RAMS • Everyday 24-hour nowcast 48-hour forecast without wind 72-hour forecast (PWS-RAMS) • Automated download of near-realtime observational data (wind, sea level, water temperature) • Output to website in graphic/tabular format • http://pws-nfs-osri.rsmas.miami.edu
Sea Level at Valdez (barometric pressure compensated)
PWS-NFS with RAMS wind • Since March 17, 2003 • Same configuration as PWS-NFS with NDBC wind • RAMS wind field is uploaded everyday to UM from UAA • 1-hour interval, 36-hour forecast • Converted to 10 m height and interpolated onto model grid • Run with RAMS wind field for 3 days (past 24-hour RAMS + 36-hour RAMS forecast) • Post results at web • Archive RAMS wind (first 24 hours for next day forcing and comparison) • Comparison plots at NDBC locations (at 5 m height) • Display 3-hour interval RAMS wind field
Some Attributes OF PWS-RAMS (Operated AT AEFF, UAA) • VERSION 4.3, NON-HYDROSTATIC • TRIPLY NESTED (HORIZONTALLY) • PARENT GRID (50 X 50); DX,Y = 64 KM; (3200 KM X 3200 KM) • SECOND GRID (70 X 58); DX,Y = 16 KM; (1120 KM X 928 KM) • FINE GRID (102 X 82): DX,Y = 4 KM; (408 KM X 328 KM) • VERTICAL COORDINATE IS STRETCHED SIGMA • 36 GRID POINTS • INITIAL DELTA_Z 50 M • STRETCHING FACTOR IS 1.13 • MAXIMUM GRID SIZE IS 1 KM • INITIALIZATION FROM NCEP ETA MODEL • INITIAL ANALYSIS & FORECAST FROM 12Z OPERATIONAL RUN • PROVIDES 3-DAY INITIALIZATION & TIME-VARYING BOUNDARY CONDITONS • http://aeff.uaa.alaska.edu/
RAMS WIND NDBC RAMS
Validation Experiment • Seasonal Cycle of 1996 (SEA) • Hourly Wind (NDBC 46060) • Monthly Heat Flux (COADS) • Short Wave Radiation (COADS Cloud Cover) • Monthly Freshwater Flux (Hydrological Model) • 0.01o 0.02o (~1.1 km) 15 levels • 1995~1997 ADCP Mooring near HE • Mellor-Yamada 2.5 Turbulence Closure Scheme • HORCON=0.1, TPRNI=0.2, Water Type=III • Three Cases depending on velocity condition at open boundary Case 1 - Daily Velocity Profile Case 2 - Daily Transport Case 3 - Monthly Transport
ADCP Mooring at HE Observed Monthly Transport Velocity Profile Daily Transport
Temperature Comparison at CLAB in 1996 Observed Monthly Transport Velocity Profile Daily Transport
Temperature and Salinity at CFOS13 April June Sept. Dec.
Challenges • Extended PWS (EPWS)-NFS and link to a larger domain model (Global NCOM) • Coupling with PWS-RAMS – heat flux, E-P, etc. • Forecast freshwater flux using the hydrological model and PWS-RAMS • Link to ecosystem model • Add a wave model
Hydrological Model (Simmons 1996) • Watersheds (289) are delineated based on digital elevation model • Model is driven by climatological daily air temperature and precipitation and considers variations in elevation and glacier distribution • 241 watersheds inside PWS-NFS domain are used (since12 MAR03)
Daily freshwater discharge through precipitation and land discharge • Daily, non-uniform land discharge along coastline • Precipitation is applied uniformly to all grid points