Download

1 / 31
310 likes | 400 Views
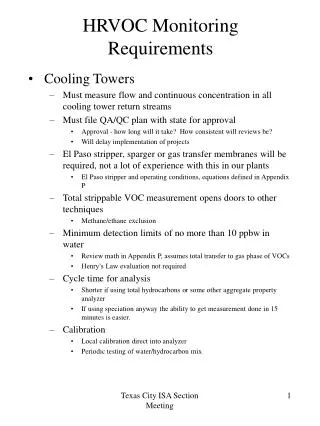
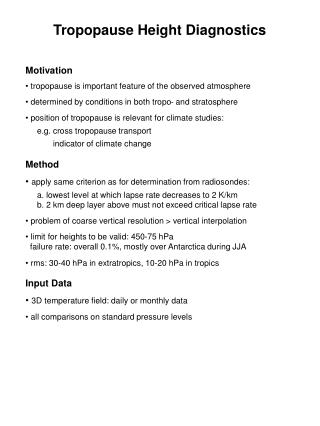
Requirements for monitoring the global tropopause. Bill Randel Atmospheric Chemistry Division NCAR. Tropopause is most simply identified by a change in stability (lapse rate). tropical tropopause. midlatitude tropopause. Latitudinal structure of the tropopause.

E N D
Requirements for monitoringthe global tropopause Bill Randel Atmospheric Chemistry Division NCAR
Tropopause is most simply identified bya change in stability (lapse rate) tropical tropopause midlatitude tropopause
Tropopause separates air masses with differentdynamical and chemical characteristics Ozone
definitions of the tropopause • Lapse rate tropopause (WMO definition) • Cold point (most relevant in the tropics) • Specific value of potential vorticity (PV=2) advantage: continuously valued, useful for dynamics/transport studies disadvantage: requires meteorological analysis; cannot calculate from temp profiles alone
What are the science issues re: tropopause and climate? • Is the tropopause a sensitive indicator of climate change? (if so, what parameters?) • How is the tropopause related to long-term ozone variability?
Contributions of Anthropogenic and Natural Forcing to Recent Tropopause Height ChangesSanter et al. Science, July 2003 increase in global tropopause height of ~0.2 km
Spatial ‘fingerprint’ oftropopause changes observations (NCEP data) decrease in tropopause pressure (increase in altitude) climate model with changing CO2, ozone, aerosols, ...
caveat: vertical resolution of modelsand (some) observations can be ~2 km ~ 2 km
Correlation of ozone and tropopause height on short and long time scales column ozone and tropopause height at Hohenpeissenberg WMO, 2002 updated from Steinbrect et al 2001
What are the requirements to monitor the tropopause? • Key point is vertical resolution (plus spatial sampling) compare statistics for different measurements: * radiosondes * GPS radio occultation (GPS/MET, CHAMP, SAC-C) * operational analyses / reanalyses (ERA40, NCEP)
statistical distribution of tropopause heights from radiosondes at Pittsburgh 1994-2003 January note two maxima
seasonal variation at Pittsburgh 1994-2003 January July
lowest tropopause at Pittsburgh 1994-2003 January July
How do tropopause statistics depend on vertical resolution? GPS radiosondes
Sondes vs. ERA40 and NCEP radiosonde ERA40 (60-level) NCEP (17-level)
Tropopause statistics from reanalyses ERA40 (60-level) radiosondes NCEP (17-level) note lower resolution
Other statistics: occurrence of multiple tropopauses example from GPS data
double tropopause associated with break near subtropical jet tropopause from aircraft profiler measurements potential vorticity (from analysis) zonal wind (from analysis) from Pan et al., JGR, 2004
aircraft ozone measurements tropopause break associated with stratospheric intrusion
seasonal variation of profiles with multiple tropopauses radiosondes GPS
Spatial pattern of multiple tropopauses from GPS data January
occurence of multiple tropopauses in January ERA40 GPS NCEP undersampled by lower resolution
long-term variability in occurrence of multiple tropopauses fraction of soundings with multiple tropopause
long-term variability in occurrence of multiple tropopauses fraction of soundings with multiple tropopause number of levels in sounding
Key points: • Vertical resolution important for tropopause statistics (anticipated changes are small...0.1 km/decade) • Similar statistics derived from radiosondes, GPS and 60-level ERA40 data (resolution ~0.5 – 1.0 km) • Lower resolution analyses (~ 2 km) undersample variability • Tropopause closely linked to ozone variability • Homogenity of data records will likely influence statistics
Increased vertical resolution after ~1995 high resolution lower resolution
12 km ‘snapshot’ of ozone from MOZART3 Courtesy Doug Kinnison