Download
1 / 26
260 likes | 426 Views
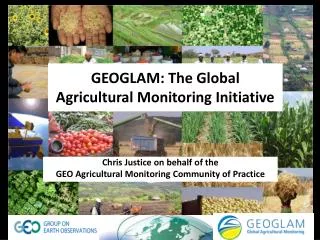
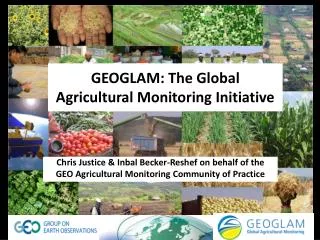
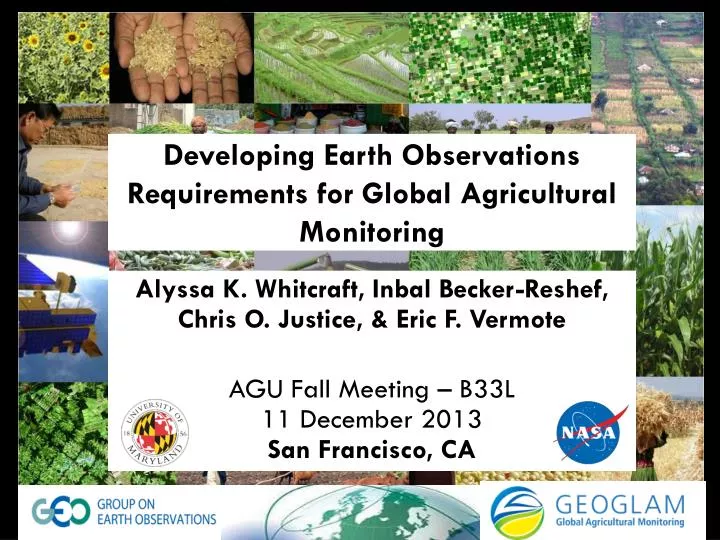
Developing Earth Observations Requirements for Global Agricultural Monitoring. Alyssa K. Whitcraft, Inbal Becker-Reshef, Chris O. Justice, & Eric F. Vermote AGU Fall Meeting – B33L 11 December 2013 San Francisco, CA. The G20 Initiative: GEOGLAM.

E N D
Developing Earth Observations Requirements for Global Agricultural Monitoring Alyssa K. Whitcraft, Inbal Becker-Reshef, Chris O. Justice, & Eric F. Vermote AGU Fall Meeting – B33L 11 December 2013 San Francisco, CA
The G20 Initiative: GEOGLAM • The G20 Cannes Summit (November 2011) Action Plan on Food Price Volatility and Agriculture • Reaffirmed GEOGLAM commitment at the 2012 G20 Los Cabos Declaration & in Agriculture Ministers Report
4. EO DATA COORDINATION 5. METHOD IMPROVEMENT through R&D coordination (JECAM) 6. Data, products and INFORMATION DISSEMINATION GEOGLAM Components Stakeholders Governments AMIS FAO
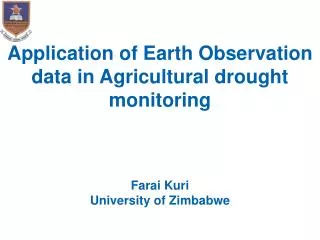
GEOGLAM Component 4: Coordination of Earth Observations • Cropping systems are inherently diverse and dynamic • No single mission can meet the variety of EO requirements • Lack of current coordination for agriculture monitoring • Committee on Earth Observations Satellites (CEOS) collaborating with GEOGLAM to devise an acquisition strategy • First step: EARTH OBSERVATIONS REQUIREMENTS
Key Components of EO Requirements • Where to image? • When to image? • How frequently to image? • At what spatial & spectral resolution [instrument type]? • ‘best-available’ cropland mask • Agricultural growing season calendars • ‘best-practices’ from agricultural monitoring community of practice
WHY? (Agricultural Monitoring Application) WHEN AND HOW OFTEN? (Temporal) WHAT? (Spatial & Spectral) WHERE? Coarse (>100 m) Moderate (10-70 m) Fine (5-10 m) Very Fine (<5 m)
Where to Image? Best Available Cropland Distribution Source: IIASA, Steffen Fritz et al. Beta Version 1
Where to Image? Field Size (beta version) Source: Fritz et al., (IIASA) Based on interpolation of 50,000 GEOWIKI validation points
When to Image?AgriculturalGrowing Season Calendars • Produced for Agricultural Areas from ten years (2001-2010) of 8-day 250m MODIS Terra Surface Reflectance (MOD09Q1) • Adjusted using strict QA bits • Converted to NDVI; aggregated to 0.5° (~56 km at Equator) based on “best available cropland masks” • Processed for “Phenological Transition Dates” (PTD) • For each growing season, 2001-2010:
Phenological Transition Dates (2001-2010) from MODIS NDVI over Cropped Areas Kansas – Winter Wheat Area Median SOS: 289 (16 October) Median EOS: 153 (2 June) Indiana – Corn/Soybean Area Median SOS: 137 (17 May) Median EOS: 273 (30 September)
GSCs vs. USDA-NASS Crop Progress for Corn (2001-2010) Yearly SOS & Percent Planted Yearly SOS & Percent Emerged Yearly EOS & Percent Harvested
How Frequently?Requirements Table + Cloud Cover • Investigating cloud cover: • Over agricultural areas, throughout the agricultural growing season (AGS) • At a resolution/with an approach that is scalable to multiple swath widths (~11 km – 720 km) of fine and moderate (FTM) resolution sensors • Probability of a Clear View at 0.05˚ • Daily; 2000-2011 [Terra-AM] and 2002-2011 [Aqua-PM] • ≥1 cloudy 1 km pixel cloudy 0.05° cell • “What is the probability that there is no cloud within a given 0.05° cell on a given day or during a certain portion of the year?” “Worst Case” Likely to over-estimate impacts of cloud cover on acquiring clear views
Where the Crops Are Terra (AM) – Western Terra (AM) – Eastern Probability of a Cloud Free Clear View at 0.05˚ Mean for each 1 degree of latitude
AM – PM (Terra – Aqua) Morning acquisitions are less impacted by clouds than are Afternoon acquisitions Western Hemisphere Eastern Hemisphere
How frequently to Image?Revisit Time Required For an 8 Day Clear View Incorporates Cropland Mask, Growing Season Calendar, and Clear View Probability
Observation Capabilities • Show the table – perhaps 1 or 2 overpass analyses • Do this to establish why you are going to show 4 day repeat [attainable with a number of mission combinations]
How Frequently? - Microwave • Highlight the areas for which microwave imagery are necessary
Future Research • Refining growing season calendars • Crop specific cropland phenology – a major dearth in the field • Validation with GEO Ag CoP • Continue comparison with observational capabilities • Acquisition plans need to be flexible to keep pace with agricultural land use change
Acknowledgements • NASA Applied Science Program • NASA Earth and Space Science Fellowship Program • GEOGLAM Partners • Jeremy Mirmelstein • Louis Giglio • Luigi Boschetti • CEOS SEO – Brian Killough