Download
1 / 21
210 likes | 223 Views
GRACE-observed water storage deficits for hydrological drought characterization. Alys Thomas 1 , J.T. Reager 1,2 , Jay Famiglietti 1,2,3 , Matt Rodell 4 1 Dept. of Earth System Science, 2 UC Center for Hydrologic Modeling, 3 Dept. of Civil and Environmental Engineering,

E N D
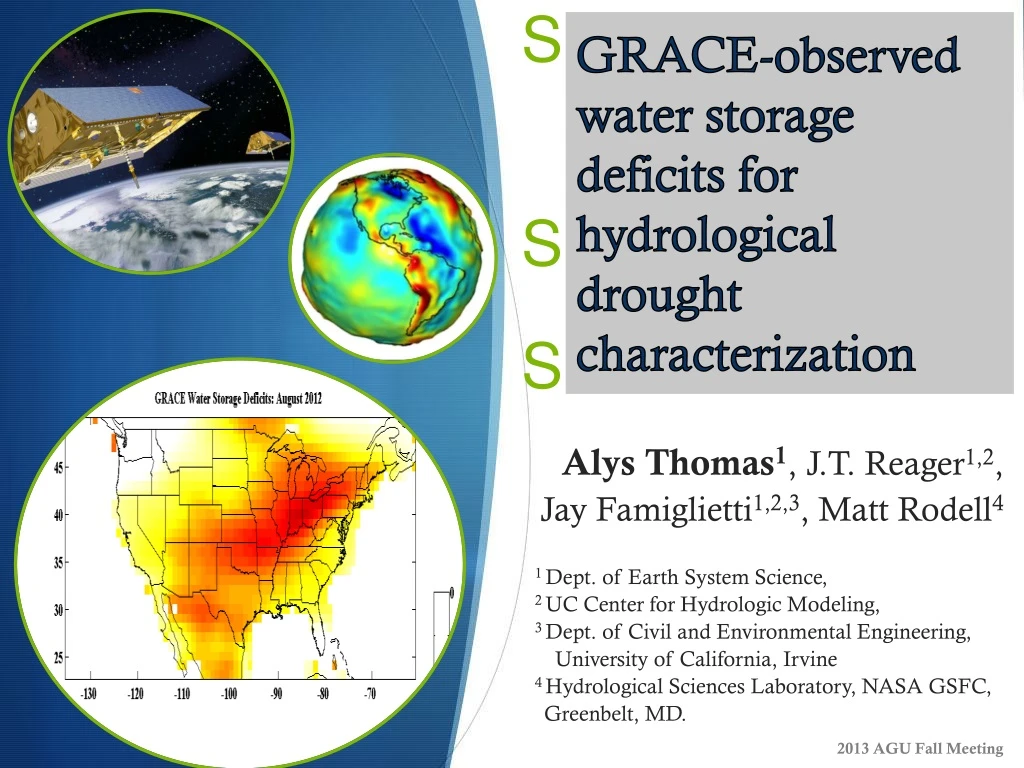
GRACE-observed water storage deficits for hydrological drought characterization Alys Thomas1, J.T. Reager1,2, Jay Famiglietti1,2,3, Matt Rodell4 1 Dept. of Earth System Science, 2 UC Center for Hydrologic Modeling, 3 Dept. of Civil and Environmental Engineering, University of California, Irvine 4 Hydrological Sciences Laboratory, NASA GSFC, Greenbelt, MD. 2013 AGU Fall Meeting
Synopsis • A quantitative framework for measuring the severity of regional water storage deficits based on terrestrial water storage observations from NASA’s Gravity Recovery and Climate Experiment (GRACE) satellite mission. 2013 AGU Fall Meeting
Importanceof Drought Characterization • Drought Characterization: • provides decision makers with a measurement of abnormal weather variability, so that protection from possible impacts may be implemented. • is complex and there are a wide range of meteorological or hydrological indices or indicators that can be used. • requires an accurate selection of drought identification methods, able to describe in a synthetic and clear manner the evolution of drought conditions in space and time. 2013 AGU Fall Meeting
What I posit to you is that • GRACE can contribute to regional drought characterization by measuring water storage deficits in a previously-identified, drought-stricken area. • The duration and magnitude of the deficit can serve as new metrics to help quantify hydrological drought severity. 2013 AGU Fall Meeting
G.R.A.C.E. Terrestrial Water Storage Anomalies • Observations of monthly changes in Earth’s gravity field caused by mass redistribution, which, over land and after removal of the atmospheric contributions, are attributed primarily to the movement of water in various surface and sub-surface hydrologic reservoirs. • UT, Austin CSR, RL05 TWSA • [ global, 1° grids ] • Jan 2003 – July 2013 • Analysis for each grid cell: • Remove the mean • Apply a 3-month moving average 2013 AGU Fall Meeting [Landerer and Swenson, 2012]
Study Regions Amazon Texas Region • Records of meteorological drought for reference • Large area to minimize GRACE error Southeastern U.S. 2013 AGU Fall Meeting
EstablishingDrought Two drought databases are referenced to identify specific meteorological drought events EM-DAT Global Drought Database U.S. Drought Monitor • Maps based on measurements of climatic, hydrologic and soil conditions as well as reported impacts and observations from more than 350 contributors around the country • Office of U.S. Foreign Disaster Assistance (OFDA)/Centre for Research on the Epidemiology of Disasters (CRED) International Emergency Events 2013 AGU Fall Meeting [EM-DAT, 2013; U.S. Drought Monitor, 2013]
An updated quantitative method… the substantialdeviation from the normal annual or seasonal cycle that can then be considered a true deficit Strong seasonality still dominates the signal 2013 AGU Fall Meeting
Methodology (1): Monthly Climatology • We compute a 127-month climatology (January 2003-July 2013) for the GRACE TWSA time series in each study region. • This climatology represents the characteristic variability of water storage and serves as a baseline for identifying the occurrence and severity of water storage deficits. • Allows us to: • characterize unique events, different from the typical annual cycle • account for regions that have little or strong seasonality 2013 AGU Fall Meeting
Methodology (2): Water Storage Deficits • Water storage deficits: • calculated as the negativeresiduals after subtracting the GRACE monthly climatology from the TWSA time series. • This distinguishes between relatively dry (negative) and wet (positive) conditions 2013 AGU Fall Meeting
Calculation of Water Storage Deficits Information about Deficits Duration, D Monthly Magnitude, M TWSA, km3 Water Storage Deficits, km3 Water that is “missing” Peak Magnitude of each event 2013 AGU Fall Meeting
Severityof Deficit Events Amazon Texas Region Instantaneous Severity (km3 * month) Southeastern U.S. Monthly Severity, S(t) (Average Magnitude) x (Months, since deficit start) 2013 AGU Fall Meeting
Contributions of this GRACE-based framework • a framework that provides additional information about how much wateris missingfrom a region {the effects of meteorological drought on the hydrological system} • a clear identification of water storage deficits and quantification of their severity with an observation that integrates both surface and subsurface storage • a consistent method for severity calculation that can be applied globally 2013 AGU Fall Meeting
Summary of Results Amazon ±11.25 mm/69.12 km3 (Amazon) ±14.55 mm/11.33 km3 (Texas), ±16.02 mm/11.75 km3 (SE USA) Texas Southeastern U.S. 2013 AGU Fall Meeting
Implicationsfor Water Resources • The severity metric ( S ) is most associated with reports of widespread, catastrophic meteorological drought. 2013 AGU Fall Meeting
Implicationsfor Water Resources cont. • Possible to monitor the intra-seasonal persistence of total water storage deficits and surpluses (even in the wet season). • Understanding the time evolution of deficit helps us understand the severity of individual events • Understanding the spatial evolution of deficits 2013 AGU Fall Meeting
Thank you Questions? • References • EM-DAT: The OFDA/CRED International Disaster Database (2013), Universite catholique de Louvain, Brussels, Belgium, http://www.emdat.be/, Accessed January 2013. • Landerer, F. W., and S. C. Swenson (2012), Accuracy of scaled GRACE terrestrial water storage estimates, Wat. Resour. Res., 48, W04531, doi: 10.1029/2011WR011453. • Tapley, Byron D., S. Bettadpur, J. C. Ries, P. F. Thompson, and M. M. Watkins (2004), GRACE Measurements of Mass Variability in the Earth System. Science, 305 (5683), 503, doi: 10.1126/science.1099192. • U.S. Drought Monitor (2013), University of Nebraska-Lincoln, National Drought Mitigation Center (NDMC), the U.S. Department of Agriculture (USDA), and the National Oceanic and Atmospheric Administration (NOAA). http://droughtmonitor.unl.edu/archive.html. Presenter Contact Info: Alys Thomas, thomasac@uci.edu 2013 AGU Fall Meeting
EstablishingDrought cont. • Standardized Precipitation Index 2013 AGU Fall Meeting