Download
1 / 41
410 likes | 544 Views
Theoretical Impacts of Habitat Fragmentation and Generalist Predation on Predator-Prey Cycles Kelsey Vitense “Current Challenges for Mathematical Modelling of Cyclic Populations” Workshop at BIRS 11/12/13. Outline: Motivation Models Results Next steps.

E N D
Theoretical Impacts of Habitat Fragmentation and Generalist Predation on Predator-Prey Cycles Kelsey Vitense “Current Challenges for Mathematical Modelling of Cyclic Populations” Workshop at BIRS 11/12/13
Outline: • Motivation • Models • Results • Next steps
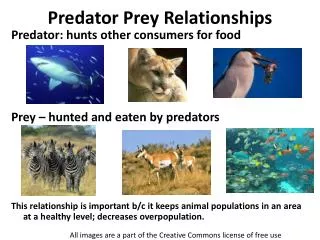
Many cyclic mammalian species undergo dramatic fluctuations in abundance in north but exhibit damped dynamics in south • Proposed Explanations: • Habitat fragmentation or patchiness • Generalist predation • Availability of alternative prey Black-tailed Jack Rabbit Brown Lemming Meadow Vole Snowshoe Hare
Many cyclic mammalian species undergo dramatic fluctuations in abundance in north but exhibit damped dynamics in south • Proposed Explanations: • Habitat fragmentation or patchiness • Heavy generalist predation • Availability of alternative prey • What are the relative and combined effects of habitat fragmentation and generalist predation on predator-prey cycles?
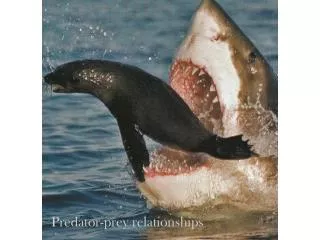
Snowshoe Hare Canada Lynx • Northern range: Boreal forest of Canada and Alaska • 8-11 year population cycle • Amplitude = 10-25 fold • Varies geographically and from period to period • Southern range: Northern US and Great Lakes • More mountainous and fragmented • Amplitude = 2-25 fold • Lower peak densities in South • Canada Lynx – Listed as threatened in lower 48 states
Approach: • Limited data on southern populations • Use models to do “experiments” to test hypotheses • Start with dynamics similar to north with parameter ranges taken from literature • Perturb system according to parameters expected to be different in southern range
Reaction-Diffusion-Advection Models • n = n(x,t) = population density at position x at time t
Reaction-Diffusion-Advection Models • n = n(x,t) = population density at position x at time t • D(x) - measure of how quickly individuals spread apart from each other • V(x) - measure of how quickly individuals move together • f(n,x) describes change in population density due to reproduction, natural mortality, etc.
500 particles initially centered at x=0 Each particle moves right with probability a Each particle moves left with probability b Symmetric Random Walk (Diffusion) Biased Random Walk (Diffusion-Advection)
A system of reaction-diffusion-advection equations can describe predator-prey interactions in space and time: • Prey and predator can have their own movement rates • Reaction terms incorporate the influence of one population on the other and may vary spatially • Strohmand Tyson (2009) used this framework to show that habitat fragmentation reduces cycle amplitude and average densities
Hare-Lynx (North) X L 0 May Reaction Terms r = hare intrinsic growth rate k = hare carrying capacity α = lynx saturation kill rate (hares/lynx/yr) β = lynx half-saturation constant (hares/ha) s = lynx intrinsic growth rate q = minimum hares per lynx (lynx carrying capacity is H/q)
Hare-Lynx (North) X L 0 May Reaction Terms Type II response = Specialist r = hare intrinsic growth rate k = hare carrying capacity α = lynx saturation kill rate (hares/lynx/yr) β = lynx half-saturation constant (hares/ha) s = lynx intrinsic growth rate q = minimum hares per lynx (lynx carrying capacity is H/q) H
Densities in Space through One Cycle PREY PREDATOR
Densities in Space through One Cycle: Higher Diffusivities PREY PREDATOR
Hare-Lynx with Habitat Fragmentation (South) X L 0 G G B B B • V(x) = spatially varying velocity • Pulls hares and lynx toward “good” patches • r(x) = spatially varying hare intrinsic growth rate • Positive in “good” patches Strohm and Tyson (2009)
Limit Cycles for Different Good Patch Sizes: 1 Good Patch, 1 Bad Patch Good Patch Size
CYCLE PROBES VS GOOD PATCH SIZE: 1 Good Patch, 1 Bad Patch PREY PREDATOR Fragmentation
PREY CYCLE PROBES VS GOOD PATCH SIZE: 1 Good Patch, 1 Bad Patch Max Min Avg Amp Fragmentation
Hare-Lynx with Generalist predation (South) Aggregate Generalist Term X 0 L γ = Maximum generalist killing rate (hares/ha/yr) η = Generalist half-saturation constant (hares/ha)
Hare-Lynx with Generalist predation (South) Aggregate Generalist Term X 0 L γ = Maximum generalist killing rate (hares/ha/yr) η = Generalist half-saturation constant (hares/ha) • Type III response = prey switching • Increase γ for higher generalist pressure H
Limit Cycles at Different Levels of Max Generalist Predation: Single Good Patch Predation Rate Oscillations stop around γ=.5 hares/ha/yr. Estimates from Kluane study put γ between .1-2 hares/ha/yr
Cycle Probes Vs. Max Generalist Predation Rate Prey Predator
Prey Cycle Probes Vs. Max Generalist Predation Rate Max Min Avg Amp
PERTURB NORTHERN BASELINE WITH HABITAT FRAGMENTATION AND GENERALIST PREDATORS
Hare-Lynx with Generalist predation and Habitat Fragmentation (South) X 0 L G G B B B • Generalists numerically stable throughout domain • Hare and lynx drawn toward good patches • Simultaneously increase γ and fragmentation
PREY Amplitude Contour Plot Stable Predation Fragmentation
NEXT STEP: PERTURB NORTHERN BASELINE WITH HABITAT FRAGMENTATION AND GENERALIST PREDATORS EXPLOITING HABITAT EDGES
Hare-Lynx with Generalist predation and Habitat Fragmentation (South) X 0 L G G B B B • Maximum generalist killing rate higher on patch boundaries “Good” “Bad”
SUMMARY • Generalist predation has stronger, more immediate dampening effect than habitat fragmentation (for this parameterization of the May model) • Fragmentation and generalist predation both dampened oscillations by reducing cycle maximums and raising minimums • Combined dampening effects of habitat fragmentation and generalist predation are stronger than the relative effects
Impacts of Results • Shed light on useful data to be collected in future field work • Generalist predation: • Rates • Locations • Habitat Fragmentation: • Proportion of suitable habitat • Patch size • Amount of edge • Abundance estimates of the cyclic species • Long time series in an area likely to be subjected to habitat fragmentation (e.g. clear cuts)
How does a second predator’s level of prey specialization affect dynamics?
Hare-Lynx with “Specialist” Coyote (North) • μ= coyote saturation kill rate (hares/coyote*yr) • ω= coyote half-saturation constant (hares/ha) • Make coyote look like a specialist with small ω
Hare-Lynx with Increasingly Generalist Coyote (South) • Increasing ω = coyote increasingly generalist (more alternate prey available) • Decrease q (min hares needed per coyote) at the same time
Thanks to NSF for travel funds and BIRS for hosting • Thanks to my committee: Aaron Wirsing, Jim Anderson, Trevor Branch, Rebecca Tyson • UW Center for Quantitative Science for TA support
Limit Cycles for Different Good Patch Sizes: Higher Diffusivities Good Patch Size
PREY CYCLE PROBES VS GOOD PATCH SIZE: Higher Diffusivities Max Min Avg Amp Fragmentation
PREY Contour Plots – Higher Diffusivities Max Min Predation Avg Amp NOT CYCLING Fragmentation
Fragmentation spatial profiles Lower Diffusivities Higher Diffusivities Fragmentation