Download
1 / 20
200 likes | 422 Views
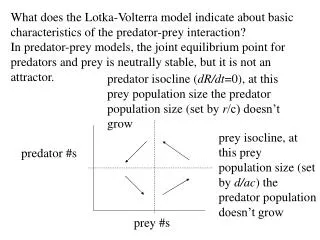
Predator & Prey. Last update 4/18/12. You will…. Know the correlation between Predator & Prey Be able to graph and understand the relationship between Predator & Prey. Nature, You Scary!. Predator/Prey Activity Worksheet!. Directions:

E N D
Predator & Prey Last update 4/18/12
You will… • Know the correlation between Predator & Prey • Be able to graph and understand the relationship between Predator & Prey
Predator/Prey ActivityWorksheet! • Directions: • Purpose: To simulate the predator/prey relationship
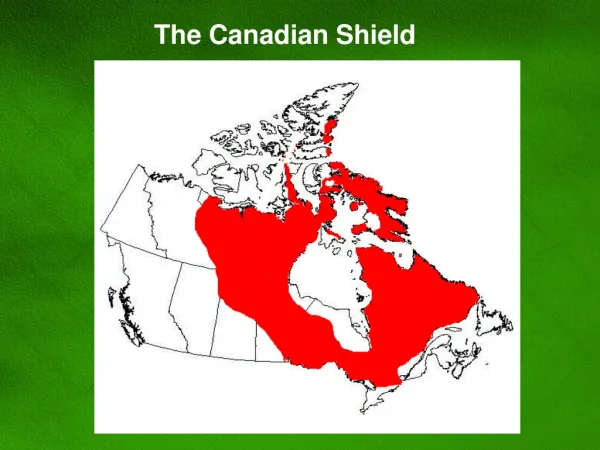
Background: • Background: Canadian Lynx and Snowshoe Hares • Predator species is totally dependent on a single prey species as its only food supply • The prey species has an unlimited food supply • There is no threat to the prey other than the specific predator.
Hypothesis • If the Lynx kill too many Hare, then the population of Lynx decrease. This is because the two populations are dependent on each other. • If the population of the Lynx is low, then the Hare population will increase. This is because the two populations are dependent on each other.
Materials • Just you! • Follow the rules. • Try!
Procedure: • Like Sharks and Minnows • But, we keep track of the data! • Follow the Rules • TRY!
Activity Rules • Activity Rules: • Each round represents one year • 3 Hare to support 1 Lynx. If you don’t tag out at least 3 hares, go to the resurrection line • Every two lynx will have one offspring every year. • Hare: 2-Handed Tag by Lynx, back of the resurrection line! One-hand tag you hop until you get tagged again! • Every 2 Hare will have 3 offspring each year. • Resurrection Line should be a straight line off to one side of the field. The dead will enter on one side, and be resurrected on the other.
Data Table Predator Prey Activity Data Table Day 1: End here!
Day 2: Start here! Data Analysis: Graph Populations of lynx vs. hare Thousands
Real World (Odum, Fundamentals of Ecology, Saunders, 1953)
Carrying Capacity • What does carrying capacity mean? Write it on your White board in your own words. • Discuss as a table. • Carrying Capacity- The maximum number of organisms that the ecosystem (due to biotic & abioticLimiting factors) can support.
Lesson of the Kaibab Deer population from 1905 to 1924 Deer population from 1925 to 1939
Conclusion QuestionsIn your Lab Book! • Describe the relationship between the variables on your graph • How close is your graph to the real graph of Lynx and Hare? Why is it close, or why is it off? • What is the lesson of the Kaibab?
Data Table – Results! 1st Period
Data Table – Results! 3rd Period
Data Table – Results! 4th Period
Data Table – Results! 5th Period
Data Table – Results! 6th Period