Download
1 / 17
170 likes | 305 Views
Judgment in Forecasting, Forecast Accuracy, Moving Averages and Decomposition. Lecture 2 February 23, 2010. When should we use judgment in forecasting?. When there’s no data When determining how much data to use When choosing a forecasting model When dealing with structural changes

E N D
Judgment in Forecasting, Forecast Accuracy, Moving Averages and Decomposition Lecture 2 February 23, 2010
When should we use judgment in forecasting? • When there’s no data • When determining how much data to use • When choosing a forecasting model • When dealing with structural changes • Adjusting outliers • Adjusting quantitative forecasts when; • the consequences are great • they don’t make sense • additional information is available that is not included in the model • the penalties differ between over and under forecasting (c) Martin L. Puterman
Why are judgmental forecasts so poor? • Forecasting is hard • Forecasters have biases • Recent events are given more weight • Forecasters often rely on anecdotal information • Ignoring data • Justification of sunk costs • Difficult to process large amounts of data • Difficult to determine which data is usual and relevant • Financial markets are efficient (c) Martin L. Puterman
Forecast the Next 5 yearsMakadakis et. al p.493 Sales (1000’s) 50 Time (c) Martin L. Puterman
Forecast the Next 5 yearsMakadakis et. al p.495 Sales Time (c) Martin L. Puterman
Judgmental Forecasting Critique • Manager’s forecasts tend to be overly optimistic. • Studies shows they are outperformed by statistical models!! • Case Study (Makadakis et. al. p.493) • Mangers produced different forecasts from the same data • when told it was their companies product and when told it was a competitors product or • when told it was a new, a mature or an old product. • Most neutral parties forecasting from same data used extrapolation (trend model) and overestimated accuracy of the forecast. (c) Martin L. Puterman
Empirical evidence suggests that “expert” forecasts do not perform well • Financial forecasts: • Analysts and mutual funds consistently under perform markets or fail to predict market turns. • Mutual fund advisor incentive systems encourage erratic behavior. • Sales force forecasts: • Influenced by incentives. • Rewards for exceeding targets so set low targets or forecasts. • Sales managers set high targets for motivation. • In general such forecasts rely on anecdotal information So use inexpensive experts! (c) Martin L. Puterman
So why use judgment? • In some cases you have to. • Little data available. • Long term forecasts required. • Rapid technological or marketplace change • New products • Relationships between predictors change • Adjustment of outliers • Consequence great (c) Martin L. Puterman
Consensus Forecasting • Informal discussion and argument (committee?) • Weighted average of all forecasters • Delphi method • form individual forecasts and deliver to oracle • oracle summarizes forecasts and returns average, high, low, etc to individuals + reasons • individuals revise their forecasts • repeat process (c) Martin L. Puterman
How to improve judgmental forecasting • Review historical data • Practice; calibrate performance and give feedback • Provide ranges • high (95th percentile) • midpoint (median) • low point (5th percentile) • Provide scenarios with probabilities • Clearly separate out forecasting and decision making (c) Martin L. Puterman
Accuracy Measures • These calculations assume that we are forecasting k periods ahead and can assess its quality using a holdout sample • Yt+k = Value in Period t+k; • Ft(k) = k period ahead forecast in period t • n = forecast horizon • Period t+k forecast error = Actual - Forecast = Yt+k - Ft(k) • Mean squared error (MSE) • Square the individual forecast errors over next n periods • Sum the squared errors and divide by n (c) Martin L. Puterman
Forecasting Accuracy Measures • Mean absolute error (MAE) • Take absolute values of forecast errors • Sum absolute values and divide by n • Mean absolute percent error (MAPE) • Take absolute values of forecast percent errors • Sum percent errors and divide by n (c) Martin L. Puterman
Assessing Out of Sample Forecasts (c) Martin L. Puterman
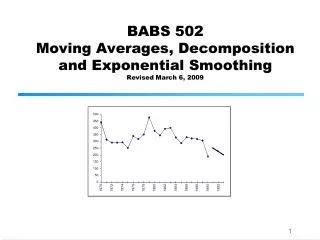
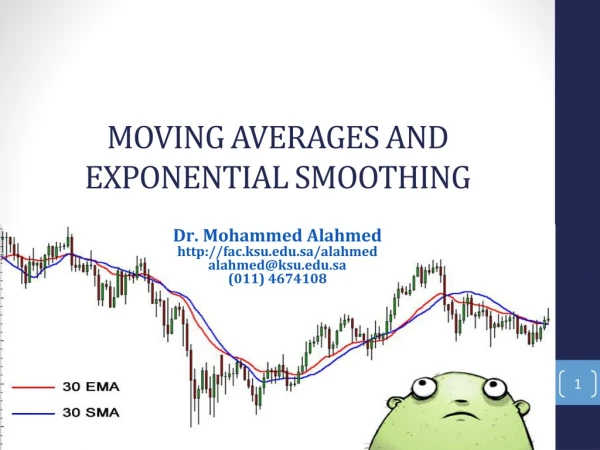
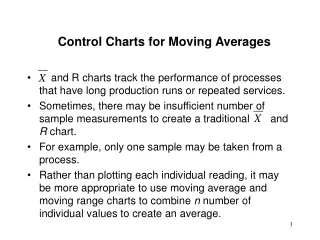
Moving Averages Ft(1) is average of last m observations Issue is to choose m Most appropriate if series is random variation around a mean This is the case if all autocorrelations are near zero Not intended as a forecasting method - best for smoothing a series and determining patterns Lags behind an increasing series Calculated in a spreadsheet using Average function or using the MAVk transformation in NCSS. Note NCSS averages past k observations. Alternatives are median smooth or LOESS smooth which are available in NCSS graphical routines. 14
Decomposition Method The decomposition method represents series • Additively as Yt = Tt + St + Ct + It • Multiplicatively as Yt = Tt St Ct It where Tt is the trend component value at time t St is the seasonal component value at time t Ct is the cyclical component value at time t It is the irregular or noise or “error” component at time t 16
Decomposition Methods • Some comments • Cyclical components not usually included since they cannot be forecasted and are hard to determine (may not exist) • The decomposition method provides a plausible approach for understanding time series behavior • Its suggests the following general forecasting approach; • Deseasonalize data – use a forecasting method for stationary or trending series on the deseasonalized data and then reseasonalize. 17