Download
1 / 17
170 likes | 298 Views
Rolling Dice Data Analysis - Hidden Markov Model. Danielle Tan Haolin Zhu. Observations-Histogram 1. Observations-Histogram 2. #1001-2000: loaded die 1?. #1-1000: fair die?. #7001-8000: loaded die 2?. Observations-Cumulative Sum.

E N D
Rolling Dice Data Analysis- Hidden Markov Model Danielle Tan Haolin Zhu
Observations-Histogram 2 #1001-2000: loaded die 1? #1-1000: fair die? #7001-8000: loaded die 2?
Observations-Cumulative Sum Fair region’s slope = 3.5; Loaded regions have approx. same slope of 4.5
Observations- Histogram 3 3rd Loaded Region 1st Loaded Region 5th Loaded Region
Observations • 2 dice: One is fair, one is loaded. • Loaded regions are: #1500-1980; #3690-3790, #4250-4660, #5700-6500 & #7000-7700 • Probability of 6 on the loaded dice is ½. • Once either of the dice is used, it will continue being used for a while.
Hidden Markov Model • Known information: A sequence of observations with integers between 1-6. • Questions of interest: • How was this data set generated? • What portion of the data was generated by the fair dice and loaded dice respectively? • What are the probabilities of the transition between the dice? • What is the probability of generating 6 using the loaded dice?
Hidden-Markov Model Probabilities of the transition between the two states. Define two states: 0.05 Loaded Fair 0.05 0.95 0.95 A guess from observation! Transition Matrix:
Hidden-Markov Model • In each state, there are 6 possible output: Emission Matrix: Again a guess!
Hidden-Markov Model A set of observations: The states are hidden: For example: s=(FFFFFFFFLLLFFFLL…) Given the output sequence y, we need to find the most likely set of state transition and output probabilities. In other words, to derive the maximum likelihood estimate of the parameters (transition probabilities) of the HMM given a dataset of output sequences.
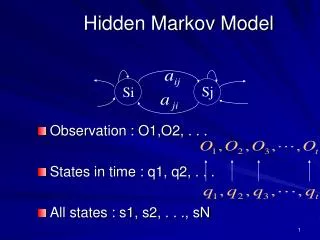
Forward-Backward algorithm What is the probability that the actual state of the system is i at time t? • The probability of the observed data up to time t: • The probability of the observed data after time t: • Then:
Baum-Welch re-estimation • Notice that we are using a guess of the transition matrix and the emission matrix! • Re-estimation of A and b: • Then we are able to iterate until it converges—we keep track of the probability of the whole data set generated by the given parameters until it converges to a maximum.
Results • Transition matrix: • Emission matrix:
Results • Time when the loaded dice was used:
Results • Histogram of the data generated by the Hidden-Markov model:
Results • Cumulative sum of the data generated by the Hidden Markov model:
Results • Log of the likelihood