Download
1 / 15
150 likes | 296 Views
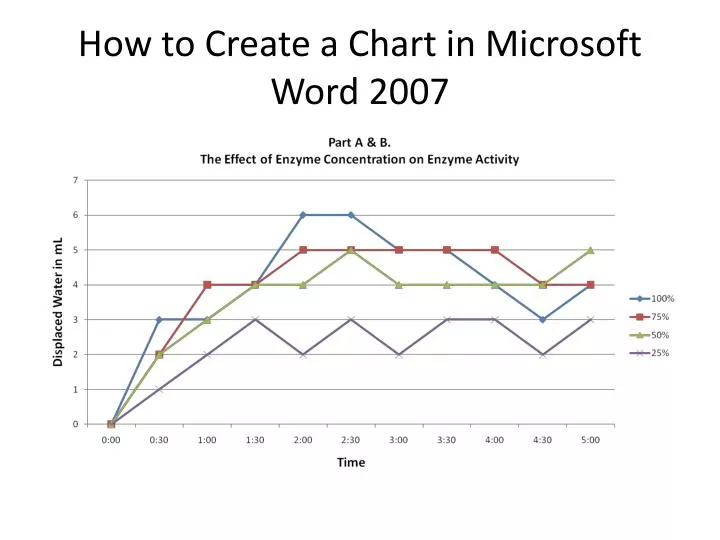
How to Create a Chart in Microsoft Word 2007. Open Microsoft Word 2007 *If you are working in Microsoft Word 2004 or maybe even a Mac, you will not be able to follow these exact instructions. It is fairly similar though. 2. In the Insert tab, select Chart.

E N D
Open Microsoft Word 2007 • *If you are working in Microsoft Word 2004 or maybe even a Mac, you will not be able to follow these exact instructions. It is fairly similar though.
3. An Insert Chart dialog box will open up. Under Line, select Line with Markers. This graph will make your data easy to read.
4. A Microsoft Excel spreadsheet will open up side-by-side to your Microsoft Word document.
Blue outline Adjust the size by dragging the bottom right corner 5. You will now enter your data into the Microsoft Excel spreadsheet. Select all of the data that was included when setting up the graph. Enter your data into the Microsoft Excel spreadsheet in the same way that is shown. If you do not, your graph may turn out wrong. Make sure that you have the blue outline around ALL of your data. Any data outside of it will not be included. *You should only be entering 0 for the 0:00 time. If a Source of Error occurred, do not put 0. Leave the cell for that time empty.
6. After you exit out of your Microsoft Excel spreadsheet, your chart will be completely updated. *If you need to edit your data, go to slide BLANK to find out how.
7. To insert a chart title, select your chart. A set of tabs called Chart Tools will appear. Under the Layout tab, select Chart Title> Above Chart. To edit the title, double-click on the text box.
8. To insert a horizontal axis title, select your chart. A set of tabs called Chart Tools will appear. Under the Layout tab, click Axis Title > Primary Horizontal Axis Title > Title Below Axis. To edit the horizontal axis title, double-click on the text box.
9. To insert a vertical axis title, select your chart. A set of tabs called Chart Tools will appear. Under the Layout tab, click Axis Title > Primary Vertical Axis Title > Rotated Title. To edit the vertical axis title, double-click on the text box.
10. After you have completed your first chart, you can simply copy it and save yourself some work. Select the chart, then right-click > Copy.
12. To edit the new chart, first select it. A set of tabs called Chart Tools will appear. Under the Design tab, click Edit Data.
13. A Microsoft Excel spreadsheet will open up side-by-side to your Microsoft Word document. Edit the data, then close the Microsoft Excel spreadsheet.
13. Your new chart will be updated with the data you entered.