Download
1 / 33
330 likes | 428 Views
The Mississippi River Sediment and QW Data Information Network. Phil Turnipseed, PE for John R. Gray Office of Surface Water Reston, VA 20192. Interagency Mississippi Valley Division Meeting Memphis, Tennessee November 17, 2009.

E N D
The Mississippi River Sediment and QW Data Information Network Phil Turnipseed, PE for John R. Gray Office of Surface Water Reston, VA 20192 Interagency Mississippi Valley Division Meeting Memphis, Tennessee November 17, 2009
The Mississippi River Sediment and QW Data Information Network USGS Coordination team: John R. Gray – Team Leader Charles Demas Andrew Ziegler Arthur Horowitz Dale Blevins USASC Coordination team: Chuck Shadie – Team Leader
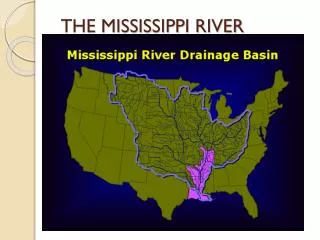
National Monitoring Network (NMN) Current design approved by ACWI on April 5, 2006; endorsed by Corps, EPA, USGS, NOAA (NOS &NWS), TVA, USDA (NRCS & USFS), DOI (BLM, NPS, OSM, USFWS), many regional and state orgs 352 HUC 6 Accounting units (about 130 in MS basin) 2,262 HUC 8 Cataloging units WQ issues: DO, nutrient enrichment, toxics, sedimentation, harmful algal blooms, habitat degradation, invasive species, and pathogens (indicator bact.) Pilots studies report completed Advisory Committee on Water Information http://acwi.gov/monitoring/network/
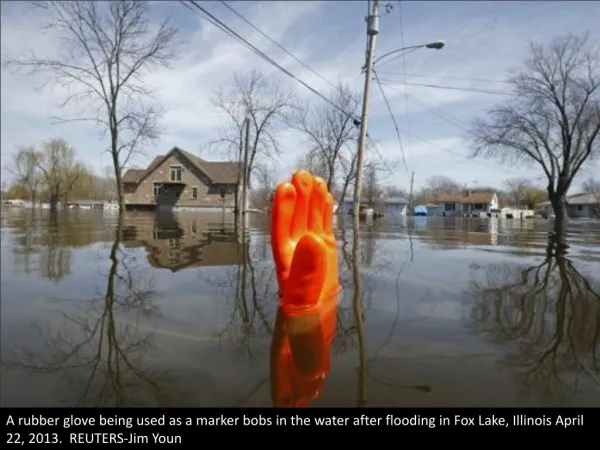
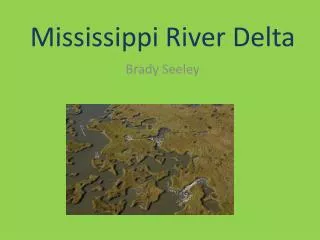
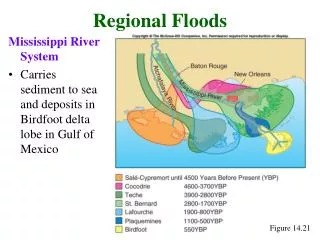
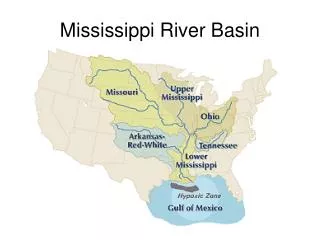
Problem • Annual loss of 25 - 40 mi2 of LA coastal wetlands due in part to • Anthropogenic disturbance; • Sea level rise; • Subsidence; • “Sediment Starvation”; • Sediment-bound nutrients contribute to Gulf of Mexico Hypoxic Zone (since 1985 has ranged in size from 100 mi2 to 8,500 mi2). • Recent studies contend that about 50% of transport loss is attributable to Missouri River dams and reservoirs;
Gulf of Mexico Hypoxic Zone Gulf of Mexico Hypoxic Zone
Background • Sediment data in Mississippi River Basin are highly variable with space and time; • Inconsistencies in sample frequency, collection and sample analysis methods, and record-computation techniques; • Sampling sites established for localized goals without a true network design to address basin-scale issues; • No one-stop data shopping.
Objectives Develop and implement a long-term sediment- and solid-phase chemistry monitoring network based on Network Design and State-of-Art Technologies Evaluate historical sediment-flux data; compute (or recompute where needed); Network Design = Appropriate sites (spatial, temporal) and consistent instruments, data-collection and computation methods. Ultimately identify trends in sediment and solid-phase chemistry loads
Overviews of: Data Availability Data Collection Instruments and Methods Load Computation Schemes New Capabilities that may Revolutionize Acquisition of Fluvial-Sediment and QW Data
Availability of suspended sediment loads Sed Loads @ 2 sites
Overviews of: Data Availability Data Collection Instruments and Methods Load Computation Schemes New Capabilities that may Revolutionize Acquisition of Fluvial-Sediment and QW Data
Data-Collection Methods Used 1939 - 1954
Conventional Equipment and Methods Federal Interagency Sedimentation Project Samplers and Sampling Techniques are the Standards for quality- assured data USA, and International Standards Organization
Overviews of: Data Availability Data Collection Instruments and Methods Load Computation Schemes New Capabilities that may Revolutionize Acquisition of Fluvial-Sediment and QW Data
Computational Methods Porterfield (1972) – Traditional “daily record” computation method – concentration time series “Simple” transport curves Multi-parameter stochastic models – Estimator, Loadest, others Continuous measurement would be best to use along with defined uncertainty.
Overviews of: Data Availability Data Collection Instruments and Methods Load Computation Schemes New Capabilities that may Revolutionize Acquisition of Fluvial-Sediment and QW Data
SURROGATE TECHNOLOGIES FOR SUSPENDED SEDIMENT Those based on: Acoustic Backscatter (Hydroacoustics) Multi-Frequency Optics Laser Diffraction Digital Photo-Optic Imaging Pressure Difference Gamma Attenuation Bulk Optics (Attenuation and Scatterance)
In-Situ Hydroacoustic technologies Upward-looking Side-looking
Hudson River – Hydroacoustic Equipment Two 600 kHz RDI Sentinel ADCPs used in rotation. Initial deployments were self contained, since changed to a 400-ft land line. Hydroacoustic Technologies
Hudson River Cross-Section Adjustments • Cross Sectional Adjustment: • “Box-coefficient” based on ADCP cross-sectional estimates of Suspended Sediment Concentration
Laser Technologies LASER Diffraction Deployed in-situ in blue Water, Estuaries, Rivers Additionally, USGS has project with Manufacturer to develop streamlined laser scattering device (Gray, 2002)
Isokinetic withdrawal LISST-SL • Active control, pump-assisted • isokinetic withdrawal • Pitot tube velocity sensor • 2-Wire communication • Optional internal battery • Low drag permits low weight. Cooperative Research and Development Project among Sequoia, Sci., Inc.,USGS, FISP
Colorado River at Grand Canyon Laser, acoustic, and optical technologies arrayed
Silt and Clay concentration in mg/L From David Topping, USGS
Summary Evaluate historical sediment-flux data, and recompute as needed: - Started in Lower Missouri River (Omaha District and USGS Kansas City Office (Blevins/Heimann) - Loads computational scheme evaluation Implement a long-term sediment- and solid-phase chemistry monitoring network based on Network Design and State-of-Art Technologies: – Turbidity protocol available – hydroacoustics soon?
Summary Identify trends in sediment and solid-phase chemistry loads -- Needs: – Comparable, quality-assured data – Comparative data (traditional, surrogate, modeled) Make these data available from a online single portal: – Presumably tractable policy issues on Furnished Data
Proposal for the network will be presented at the nextHQ Interagency Coordination meeting on February 2, 2010in Reston, Virginia
Thanks! John R. Gray jrgray@usgs.gov Office of Surface Water Reston, VA