Download
1 / 27
270 likes | 403 Views
River Sediment Calibration Rules. Gary Shenk 6/7/05 Modeling Subcommittee. Schedule. Sediment calibration completed Initial nutrient calibration by August 1. Refinements will follow over the next 18 months. Calibration Method. Flow Automatic calibration method developed

E N D
River Sediment Calibration Rules Gary Shenk 6/7/05 Modeling Subcommittee
Schedule • Sediment calibration completed • Initial nutrient calibration by August 1. • Refinements will follow over the next 18 months.
Calibration Method • Flow • Automatic calibration method developed • Edge-of-Field Sediment • Automatic calibration method developed • River Sediment • Two out of three ain’t bad • Developed calibration rules and applied them by hand
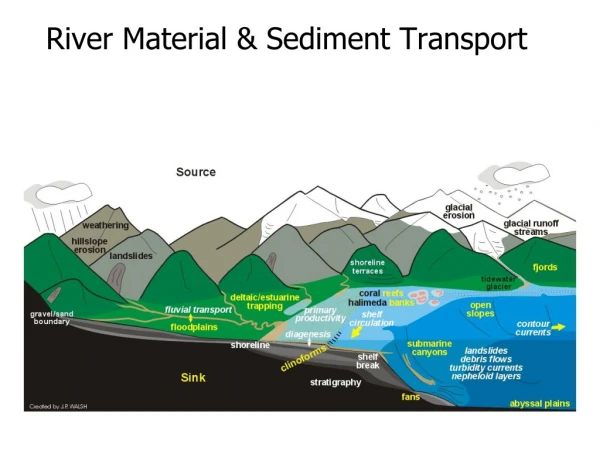
Outflow Inflow Deposition Scour River Cohesive Sediment Simulation Suspended Sediment Bed Storage (unlimited)
Deposition River Sediment Simulation Bed Storage (unlimited)
Scour River Sediment Simulation Bed Storage (unlimited)
River Sand Simulation Adjustments are then made to the bed depth
All rivers segments upstream of a calibration point have identical parameters For nested rivers, this applies only to rivers downstream of any upstream gages. Remington Robinson Rappahannock Calibration Rules 1
Stau 97 percentile Ctau 93 SW .001 inches/sec CW .0001 CM = 1 lb/ft^2/day SM = 1 KS = .003 empirical ES = 4 High flow in the ballpark, but low flow is a problem. Lowest concentrations are mostly VSS, which is not yet simulated and are at LOD in the observed
Stau 97 Ctau 93 SW .001 CW .0001 CM = 1 SM = 1 KS = 3 ES = 3 To deal with the lack of VSS in the simulation, use SAND to make the low concentrations work out. This can be easily reversed when VSS are simulated
Stau 99 Ctau 96 SW .001 CW .0001 CM = 1 SM = 1 KS = 3 ES = 3 Reduce the frequency of scour to deal with over-simulation
Stau 99 Ctau 96 SW .001 CW .0001 CM = .5 SM = .5 KS = 3 ES = 3 Reduce the effect of scour to deal with over-simulation
Stau 99.5 Ctau 98 SW .001 CW .0001 CM = .5 SM = .5 KS = 2.8 ES = 3 Tighten up the simulation
Issues with simulation • Low values dominate the CFD, but they are not meaningful from: • A load standpoint • An accuracy of observation standpoint • Simulation standpoint (no VSS) • Flow not perfectly calibrated • If peak is missed by a day, then the concentration simulation should not match the observed.
If simulated or observed value is below 10 mg/l set it to 10 mg/l. Check simulation for 24 hours before and after observation and set simulated value to point closest to observation. ‘Windowed’ comparison Of the highest observed and simulated peaks at all calibration stations, almost as many peaks occurred one day apart, but few occurred on two days apart One day apart – 83% of the same day figure Two days apart – 19% of the same day figure
Stau 97 Ctau 93 SW .001 CW .0001 CM = 1 SM = 1 KS = .003 ES = 4 Starting point
Stau 97 Ctau 93 SW .001 CW .0001 CM = 1 SM = 1 KS = 3 ES = 3 Sand Calibration
Stau 99 Ctau 96 SW .001 CW .0001 CM = 1 SM = 1 KS = 3 ES = 3 Reduce Frequency of Scour
Stau 99 Ctau 96 SW .001 CW .0001 CM = .5 SM = .5 KS = 3 ES = 3 Reduce effect of scour
Stau 99.5 Ctau 98 SW .001 CW .0001 CM = .5 SM = .5 KS = 2.8 ES = 3 Tighten up calibration
Other Considerations: Load 1:1 plot, error vs Shear stress, Load Frequency
# of Stations 50 80 12 8 14 164
Plan • Following calibration rules, team has calibrated all stations this month. • Jing Wu – Susquehanna, Coastal Plain, Southern Rivers • Ross Mandel – Potomac, Patuxent, Choptank • Doug Moyer – James, Appomattox • Jason Pope – Rappahannock, York
Hope for automation • Separate out sections of the CFD • Low part: sand - VSS • Highest part: silt • Mid-high part: clay • PEST • Few parameters • Short run time ~ 1-2 minutes