Download
1 / 36
360 likes | 630 Views
Decision-making II choosing between gambles neural basis of decision-making. Do we always make the best possible decisions?. Normative (or prescriptive) theories : tell us how we should make rational decisions E.g. optimize financial gain

E N D
Decision-making IIchoosing between gamblesneural basis of decision-making
Do we always make the best possible decisions? • Normative (or prescriptive) theories: tell us how we should make rational decisions • E.g. optimize financial gain • Descriptive theories: tell us how we actually make decisions, not on how we should make them. • Behavior can deviate from normative account in systematic ways
What are rational decisions? • Decisions that are internally consistent • E.g., • if A>B, then B<A • if A>B, B>C, then A>C (transitivity) • Decisions that optimize some criterion • E.g. financial gain (classic expected utility theory)
Example • What is the best choice? A) .50 chance of winning $20 B) .25 chance of winning $48
Classic Expected Utility Model • Theutility of an outcome is a numerical score to measure how attractive the value associated with an outcome is to the decision-maker. • In classic expected utility model, we assume that utility = value
Classic Expected Utility Model • The expected utilityis the summed utility of a each outcome, weighted by the probability of the outcome occurring. • A rational decision-maker should always choose the alternative that has the maximum expected utility. probability utility
Example (1) • Gamble: if you roll a 6 with a die, you get $4. Otherwise, you give me $1. • Take the gamble? • Expected utility = p(win)*u(win) + p(lose)*u(lose) =(1/6)*(4)+ (5/6)*(-1) =-1/6 • So...do not take bet
Example (2) • Which job would you accept: Job A: 50% chance of a 20% salary increase in the first year Job B: 90% chance of a 10% salary increase in the first year • The classic expected utility model predicts Job A to be better (0.5 x 0.2 > 0.9 x 0.1)
Limitations of the Classic Expected Utility Model • We can make “bad decisions”—that is, decisions that are do not make sense according to the expected utility model • Violations of transitivity • Framing effects
Violations of Transitivity • Transitivity: If you prefer A to B and B to C then you should prefer A to C. • Experiment included the following gambles (expected values were not shown): • Result: subjects preferred: • A>B, B>C, C>D, D>E, but also E > A (Tversky, 1969)
Framing effect • Problem 1: • Select one of two prizes (36%) An elegant Cross pen (64%) $6 • Problem 2: • Select one of three prizes (46%) An elegant Cross pen (52%) $6 (2%) An inferior pen (Shafir & Tversky 1995)
50% 50% Example: Cheeseburgers
30% 60% 10% Example: Cheeseburgers 50% 50%
Framing effect • Version A: Imagine that you have decided to see a play where admission is $10 per ticket. As you enter the theater you discover that you have lost a $10 bill. Would you still pay $10 for a ticket for the play? • Version B: Imagine that you have decided to see a play and paid the admission price of $10 per ticket. As you enter the theater you discover that you have lost the ticket. The seat was not marked and the ticket cannot be recovered. Would you pay $10 for another ticket? Yes 88% No 12% Yes 46% No 54% (Tversky & Kahneman, 1981)
Framing effect • Problem 1 Suppose I give you $300, but you also have to select one of these two options: • 1.0 chance of gaining $100 • .50 chance of gaining $200 and a .50 chance of gaining nothing • Problem 2 Suppose I give you $500, but you also have to select one of these two options: • 1.0 chance of losing $100 • .50 chance of losing $200 and a .50 chance of losing nothing (72%) (28%) (36%) (64%) (Tversky & Kahneman, 1986)
Prospect Theory • For most people, the utility of an amount of money is not equivalent to the monetary value, it is based on the subjective utility • Example: What is the best choice? (A) .10 chance of winning $10 million dollars (B) .99 chance of winning $1 million dollars • Each additional dollar added to wealth brings less utility (“diminishing marginal utility effect”)
Prospect Theory Diminishing marginal utility: additional gains (or losses) are not valued as much as early gains (or losses) A hypothetical function relating subjective utility to value
Prospect Theory Loss-aversion the negative effect of a loss is larger than the positive effect of a gain
Risk Aversion for Gains Example Gamble 1: win $20 with 50% chance or $60 with 50% chance Gamble 2: win $40 with 100% chance
Risk Aversion for Gains Utility Example Gamble 1: win $20 with 50% chance or $60 with 50% chance Gamble 2: win $40 with 100% chance What would a person choose with the subjective utility function shown on left? 100 80 60 40 20 0 20 40 60 80 100 Monetary Value ($) < Gamble 2: 92x1=92 Gamble 1: 74x0.5+100x0.5=87
Prospect Theory concave utility function for gains:Risk-aversion for gains convex utility function for losses:Risk seeking for losses
Individual Differences Utility Decision Maker I (risk avoider) 100 80 60 Decision Maker II (risk taker) 40 20 0 20 40 60 80 100 Monetary Value
Subjective Probability • The probability of an event might not be based on objective statistical calculations but might be based on a subjective estimate • Overweighting of small probabilities and underweighting of likely outcomes
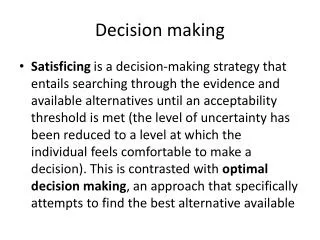
Rationality up to a point • People have limitations in memory and time • Simon (1957) • Bounded rationality • we are rational, but within limits of human processing capabilities • Satisficing • We choose the first option that meets our minimum requirements people might satisfice when making decisions such as buying a car
Neural Bases Of Expected Utility Calculations Glimcher (2003)
Surprise reactions in neurons Reward is delivered despite having never been delivered (for this stimulus) in the past Fiorillo, Tobler, and Schultz. Science. (2003)
Anticipation of reward for same neurons Reward will be delivered with probability one Fiorillo, Tobler, and Schultz. Science. (2003)
Involvement of Emotional Areas in Decisions fMRI study McClure et al. (2004)
A B C D The Iowa Gambling Task Four decks: On each trial, the participant has to choose a card from one of the decks. Each card carries a reward, and, sometimes, a loss…
A B C D The Iowa Gambling Task Four decks: +$100 −$350 Each deck has a different payoff structure, which is unknown to the participant. In order to maximize overall gain, the participant has to discover which decks are advantageous and which are not.
A B C D The Iowa Gambling Task Bad Decks Good Decks Reward per card $100 $100 $50 $50 Av. loss per card $125 $25 $125 $25
Behavioral Results with Normals and Patients with Ventromedial Prefrontal Damage (Bechara et al., 1999)
Skin conductance results in same experiment (Bechara et al., 1999)
Results • Normal (control) participants learned how to maximize wins. • Showed elevated SCR responses in anticipation of a potential large loss • Patients with ventromedial PFC damage: • Performed poorly on task (stuck with bad decks). • Did not show elevated SCR responses before poor choices.
One interpretation (controversial) • Somatic Marker Hypothesis (Damasio et al., 1996): • interpretation: we move away from the disadvantageous decks because our emotional system is warning us about the potential losses • we need our emotional brain areas to set markers to warn us about threats or opportunities • in this theory, our emotional system is assumed to have a causal influence on our decision-making