Download
1 / 20
200 likes | 1.32k Views
Titration. Titration curves are produced by monitoring the pH of given volume of a sample solution after successive addition of acid or alkaliThe curves are usually plots of pH against the volume of titrant added or more correctly against the number of equivalents added per mole of the sample. Titration of acetic acid.

E N D
1. Titration curves Of amino acids and weak acids(acetic acid)
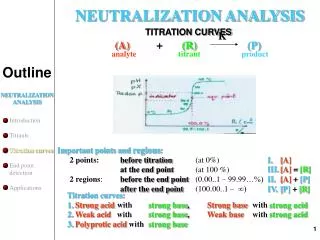
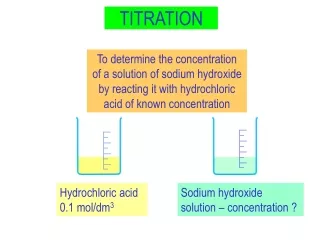
2. Titration Titration curves are produced by monitoring the pH of given volume of a sample solution after successive addition of acid or alkali
The curves are usually plots of pH against the volume of titrant added or more correctly against the number of equivalents added per mole of the sample
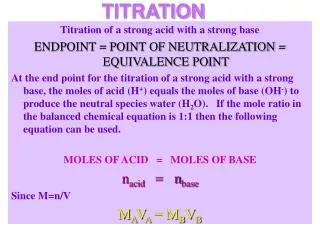
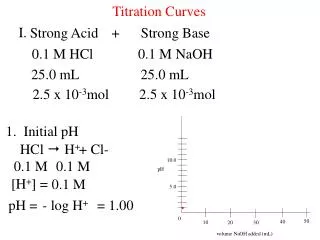
3. Titration of acetic acid At the starting point the acid form predominates (CH3COOH).
As strong base is added (e.g. NaOH), the acid is converted to its conjugate base.
At the mid point of the titration, where pH=pK, the concentrations of the acid and the conjugate base are equal.
At the end point(equivalence point), the conjugate base predominates, and the total amount of OH added is equivalent to the amount of acid that was present in the starting point.
4. Titration
5. Titration Determination of pKa values:
pKa values can be obtained from the titration data by the following methods:
The pH at the point of inflection is the pKa value and this may be read directly
By definition the pKa value is equal to the pH at which the acid is half titrated. The pKa can therefore be obtained from the knowledge of the end point of the titration.
6. Titration of amino acids Titration of glycine
Titration of arginine
7. Titration
When an amino acid is dissolved in water it exists predominantly in the isoelectric form.
Upon titration with acid, it acts as a base, and upon titration with base, it acts as an acid( a compound that can act as either an acid or a base is known as an amphoteric compound).
8. +H3N-CH2-COO- + HCl? +H3N-CH2-COOH + Cl-
(base) (acid) (1)
+H3N-CH2-COO- + NaOH? H2N-CH2-COO- + Na+ +H2O
(acid) (base) (2)
In this experiment, the amino acid represents either the A- or the HA form in the Henderson-Hasselbalch equation, depending on the titration.
9. Acid�base properties All of the amino acids have an acidic group (COOH) and a basic group (NH2) attached to the a carbon.
Two of the amino acids have acidic side chains: aspartate and glutamate.
Three of the amino acids have basic side chains: arginine, histidine, and lysine.
10. All amino acids contain ionizable groups that act as weak acids or bases, giving off or taking on protons when the pH is altered.
These ionizations follow the Henderson-Hasselbalch equation:
pH=pKa+log [unprotonated form(base)]
[protonated form (acid) ]
11. When the conc of the unprotonated form equals that of the unprotonated form, the ratio of their concentrations equals 1, and log 1=0.
Hence, pKa can be defined as the pH at which the concentrations of the protonated and unprotonated forms of a particular ionizable species are equal.
The pKa also equals the pH at which the ionizable group is at its best buffering capacity; that is the pH at which the solution resists changes in pH most effectively.
12. Consider applying the Henderson-Hasselbalch equation to the titration of glycine with acid and base.
Glycine has two ionizable groups: a corboxyl group and an amino group, with pKa values of 2.4 and 9.6 respectively.
In water at pH 6, glycine exists as a dipolar ion, or zwitterion, in which the carboxyl group is unprotonated(-COO- ) and the amino group is protonated to give the substituted ammonium ion(-NH3+).
13. Addition of acid to the solution lowers the pH rapidly at first and then more slowly as the buffering action of the carboxyl is exerted.
At pH 2.4 the pKa is reached, one-half the acid has been consumed, and the carboxyl group is half ionized and is most effective as a buffer.
Titration of the amino group with base follows a similar curve into the alkaline region.
The intersection between the titration of the carboxyl group and the titration of the amino group describes in this case the point at which glycine has no net charge, and is called the isoelectric point (pI).
14. The isoelectric point (pI) the isoelectric point, pI, is the pH of an aqueous solution of an amino acid at which the molecules have no net charge. In other words, the positively charged groups are exactly balanced by the negatively charged groups.
For simple amino acids such as alanine, the pI is an average of the pKa's of the carboxyl (2.34) and ammonium (9.69) groups. Thus, the pI for alanine is calculated to be: (2.34 + 9.69)/2 = 6.02.
If additional acidic or basic groups are present as side-chain functions, the pI is the average of the pKa's of the two most similar acids.
15. Cont.. (pI) In the case of aspartic acid, the similar acids are the alpha-carboxyl function (pKa = 2.1) and the side-chain carboxyl function (pKa = 3.9), so pI = (2.1 + 3.9)/2 = 3.0.
For arginine, the similar acids are the guanidinium species on the side-chain (pKa = 12.5) and the alpha-ammonium function (pKa = 9.0), so the calculated pI = (12.5 + 9.0)/2 = 10.75.
17. Most amino acids contain carboxyl and amino groups having pKa values similar to those of glycine.
In addition to these groups, many amino acids contain other ionizable groups, which introduce other �steps� or pKa values into their titration curves.
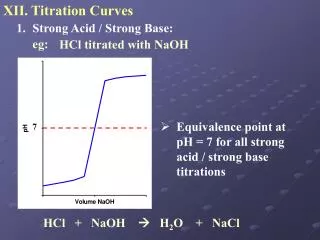
18. Titration curves The pK is the pH at the midpoint of the buffering region (where the pH changes only slightly upon addition of either acid or base).
The pK is the pH corresponding to the inflection point in the titration curve.
The end point of a titration curve represents the observed end of the titration.
The isoelectric point (isoelectric pH; pI) is the pH at which the amino acid has a net zero charge. For a simple diprotic amino acid, the pI falls halfway between the two pK values. For acidic amino acids, the pI is given by �(pK1 + pK2) and for basic amino acids it�s given by �(pK2 + pK3)