Download

1 / 13
130 likes | 157 Views
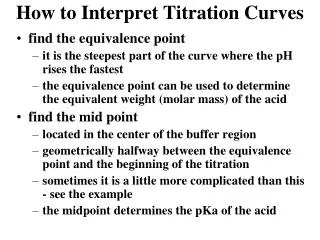
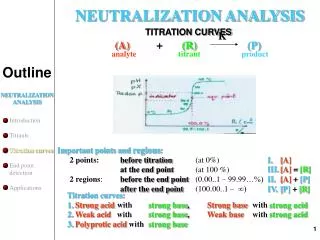
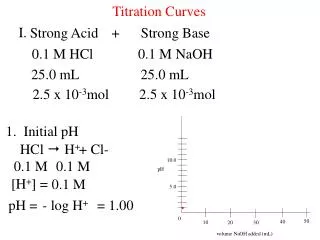
How to Interpret Titration Curves. find the equivalence point it is the steepest part of the curve where the pH rises the fastest the equivalence point can be used to determine the equivalent weight (molar mass) of the acid find the mid point located in the center of the buffer region

E N D
How to Interpret Titration Curves • find the equivalence point • it is the steepest part of the curve where the pH rises the fastest • the equivalence point can be used to determine the equivalent weight (molar mass) of the acid • find the mid point • located in the center of the buffer region • geometrically halfway between the equivalence point and the beginning of the titration • sometimes it is a little more complicated than this - see the example • the midpoint determines the pKa of the acid
How to Interpret Titration Curves • things to do first • graph your data as seen in the next slide • make sure you turn on the major and minor tick marks on both axes • right click on the axis, choose Format Axis…, change Major/Minor Tick Mark settings • Is there enough precision in the tick marks? • you should have at least 1 mL or smaller for the minor tick mark on the x-axis • you should have at least 0.2 pH units or smaller for the minor tick mark on the y-axis • Format Axis…, change Major/Minor Units
A Typical Titration Curve mid point equivalence point
Find the Equivalence Point (Geometric method) 1) using a ruler, draw a tangent line that follows the flat, more horizontal part of the curve equivalence point 2) draw a line that follows the flat, more vertical part of the curve
Find the Equivalence Point (Geometric method) 3) using a ruler, measure the distance between the top intersection and the bottom intersection equivalence point 4) the geometric center of this line segment is the equivalence point
Find the Equivalence Point (Geometric method) 5) draw a vertical line from the equivalence point to the x-axis equivalence point 6) where the line crosses the x-axis is the volume at the equivalence point (28.7 mL in this case)
Find the Mid Point (Geometric method) 1) if there is a steep rise in the pH at the beginning of the graph, draw a line that follows the steep part of the curve mid point
Find the Mid Point (Geometric method) 2) using a ruler, measure the distance between the far left and right intersections equivalence point 3) the geometric center between these points is the mid point mid point
Find the Mid Point (Geometric method) 4) draw a horizontal line from the mid point to the y-axis equivalence point 5) where the line crosses the y-axis is the pH at the midpoint (pH = 7.2 in this case) mid point
How to Interpret Titration Curves • find the mid point (half point equivalence) • This is the point when the acid is half neutralized. • mid pt = 7.2 = Ka of the acid
For you Excel Aficionados • equivalence point • use the first derivative d pH / d Vol • plot volume as x and 1st derivative as y in a 2nd series on graph • the spike in the graph points to the equiv. pt. • mid point • make a new graph and reverse the axes for the pH curve • x axis = pH values; y-axis = Vol values • use the first derivative d Vol / d pH • plot pH as x and 1st derivative as y in a 2nd series on graph • the spike in the graph points to the mid point • use extra columns in the spreadsheet to make these calcs • equiv. pt. deriv. (d pH / d Vol) = (pH2 - pH1)/(Vol2 - Vol1) • midpoint deriv. (d Vol / d pH) = (Vol2 - Vol1)/ (pH2 - pH1) • or just the reciprocal of the equiv. pt. derivative
Find the Equivalence Point (derivative method) 1) identify volume value at the peak (28.5 mL in this case) 1) identify volume value at the peak
Find the Mid Point (derivative method) 1) identify pH value at the peak (pH = 7.3 in this case)