Download
1 / 36
360 likes | 572 Views
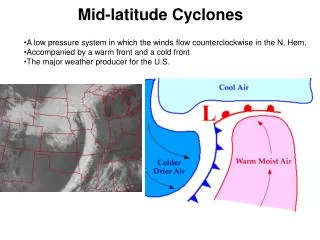
Links of the Mediterranean Oscillation to mid-latitude and tropical climate dynamics Jucundus Jacobeit, Stephanie Seubert, Armin Dünkeloh University of Augsburg. Correlations of the Mediterranean annual mean 500 hPa geopotential heigths with those of Algiers

E N D
Links of the Mediterranean Oscillation to mid-latitude and tropical climate dynamics Jucundus Jacobeit, Stephanie Seubert, Armin Dünkeloh University of Augsburg
Correlations of the Mediterranean annual mean 500 hPa geopotential heigths with those of Algiers (inside the dotted lines: statistically significant at the 95% level of confidence) + _ Conte et al. 1989
Pattern of the 500 hPa heights at the stations of Algiers and Cairo (8th order polynominal smoothing and superimposed linear trend) Cairo 500 hPa (m) Algiers Conte et al. 1989
Pattern of the 500 hPa heights at the stations of Algiers and Cairo (with superimposed linear trend and 8th order polynominal smoothing) Palutikof 2003 (after Conte et al. 1989)
Mediterranean Oscillation Index Conte et al. 1989
Mediterranean Oscillation Index (Conte et al. 1989): Difference of normalized geop. height anomalies at Algiers and Cairo Mediterranean Pressure Index (Palutikof 2003): Difference of normalized pressure anomalies at Gibraltar and Lod Mediterranean Circulation Index (Brunetti et al. 2002): Difference of normalized pressure anomalies at Marseille and Jerusalem
Luterbacher et al. 2002: Objectively reconstructed North-Atlantic-European grids of SLP and 500 hPa geopotential heights, early versions of temperature and rainfall grids since 1659 with monthly resolution
MO since 1660 winter (DJF) Algiers/ Cairo Gibraltar/ Lod Marseille/ Jerusalem
Representation of the MO by large-scale circulation patterns
500 hPa level 20.1% 1000 hPa level ONDJFM 1948-98 r = 0.60 with AO r = 0.72 with NAO Precipitation 30.4% first canonical correlation patterns for winter r ~ 0.80 with various MO indices Dünkeloh & Jacobeit 2003
r = 0.92 Smoothed time coefficients of thefirst canonical correlation patterns for winter Dünkeloh & Jacobeit 2003
SLP EV = 21.1% first canonical correlation patterns winter (DJF) 1660-1990 Precipitation EV = 14.6%
500 hPa EV = 11.7% r = 0.50 with NAO first canonical correlation patterns for winter (DJF) 1660-1990 r ~ 0.7 with various MO indices Precipitation EV = 13.4%
Smoothed time coefficients of the first canonical correlation patterns r = 0.89 winter (DJF) 1660-1990
spring (AM) 1000 hPa level 500 hPa level r = 0.85 p = 0.000 EVgpot = 10.5 % EVprec = 19.8 % precipitation second canonical correlation patterns r = 0.55 with NAO r ~ 0.5/0.6 with various MO indices Dünkeloh & Jacobeit 2003
r= 0.85 Smoothed time coefficients of thesecond canonical correlation patterns for spring Dünkeloh & Jacobeit 2003
summer (JJAS) 500 hPa level 1000 hPa level r = 0.67 p = 0.000 EVgpot = 12.2 % EVprec = 10.1 % precipitation second canonical correlation patterns r = 0.45 with NAO r < 0.4 with various MO indices Dünkeloh & Jacobeit 2003
r= 0.67 Smoothed time coefficients of thesecond canonical correlation patterns for summer Dünkeloh & Jacobeit 2003
500 hPa third canonical correlation patterns summer (JJAS) 1660-1990 Precipitation
Seasonal correlation coefficients between NAO and MO: Winter: 0.72 Spring: 0.37 Summer: (-0.13) Autumn: 0.30 (with Gibraltar/Lod, from Palutikof 2003)
Conclusions Part I: The MO is strongly linked to the NAO during winter, this relationship fades away towards summer and recovers afterwards in terms of canonical correlation patterns, the MO patterns show - from winter to summer - a gradual weakening with respect to CC coefficients and % of explained rainfall variances within this seasonal sequence, the MO is primarily an upper-level phenomenon
Teleconnection studies (StephanieSeubert): • March to November • 1951-2000 • Domain: 20°S – 70°N, 90°W – 150°E
Diagram of seasonal sections for the period March to November: 45 seasonal sections including 1-month up to 9-month sections Current number of seasonal section Length of seasonal section (number of months) Starting month of seasonal section
Teleconnection - PCA Input variables:correlation maps of 15 regional prec-indices and 45 seasonal sections cases:grid points 5 levels 13589 1000 hPA 850 hPA500 hPA250 hPA 100 hPA ... 13589 Extraction of 9 teleconnection PCs Varimax-rotated, multi-level PCA: Scores: Major teleconnection patterns Loadings: Correlation coefficients between PC-Scores and correlation maps
EV = 23 % Leading teleconnection mode (TPC 1) 250 hPA 500 hPA 1000 hPA
Loadings of TPC 1for the 15 prec.-indicesand the 45 seasonal sections (α=0.01)
Affinities between ENSO and the MO (JJAS) Iberian Peninsula Eastern Medit. Correlations with 250 hPa level MOI NINO3.4 3 TPC 1
Pearson – Correlationbetween MOI and NINO3.4 -0.73 for JJAS
Pearson – Correlations for all the 45 seasonal sections between NINO3.4 and different indices of the MO
1000 hPa 500 hPa Algiers/ Cairo Gibraltar/ Lod Marseille/ Jerusalem
Correlations of MOI (500) with geopotential heights 1000 hPa 250 hPa 850 Pa 100 hPa 500 hPa JJASO
Correlations of MOI (1000) with geopotential heights 250 hPa 1000 hPa 850 Pa 100 hPa 500 hPa JJASO
Correlations of NINO 3.4 – index with geopotential heights 1000 hPa 250 hPa 850 Pa 100 hPa 500 hPa JJASO
Conclusions Part II: There are indications for ENSO impacts on the MO: with negative sign for late summer/early autumn with positive sign for spring Opposite centres in the western and the eastern Mediterranean are confined to the lower troposphere, in the upper troposphere there is a change of sign above the eastern Mediterranean
Links of the Mediterranean Oscillation to mid-latitude and tropical climate dynamics Jucundus Jacobeit, Stephanie Seubert, Armin Dünkeloh University of Augsburg