Download
1 / 28
280 likes | 561 Views
Days 5 - 6. UNIT 1 Motion Graphs. x. t. Lyzinski Physics. Day #5 * Acceleration on x-t graphs * v-t graphs * using v-t graphs to get a. UNIFORM Velocity. Speed increases as slope increases. x. x. x. x. x. x. x. t. t. t. t. t. t. t. Object at REST.

E N D
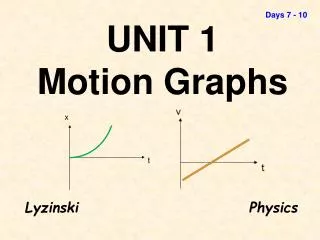
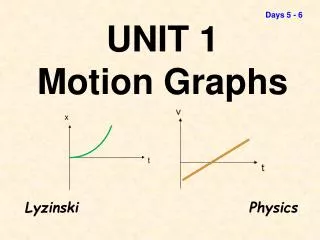
Days 5 - 6 UNIT 1Motion Graphs x t Lyzinski Physics
Day #5* Acceleration on x-t graphs * v-t graphs * using v-t graphs to get a
UNIFORM Velocity Speed increases as slope increases x x x x x x x t t t t t t t Object at REST Moving forward or backward x-t‘s Object Positively Accelerating Changing Direction Object Speeding up Object Negatively Accelerating
x x x x t t t t POSITIVE OR NEGATIVE ACCEL? SPEEDING UP OR SLOWING DOWN? • Slope of the tangent gives vinst • Getting more sloped speeding up • Getting more + sloped + Accel • Getting less sloped slowing down • Slopes are getting less + - Accel • Getting more sloped • speeding up • Slopes are getting more – • - Accel • Getting less sloped • slowing down • Slopes are getting less – • + Accel
An easy way to remember it I’m Positive!!! I’m Negative!!!
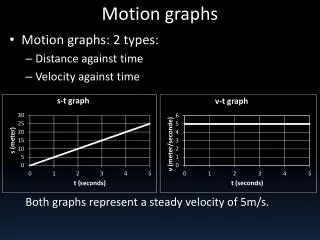
v v v v v t t t t t UNIFORM Positive (+) Acceleration Acceleration increases as slope increases Changing Direction v-t‘s UNIFORM Velocity (no acceleration) Object at REST UNIFORM Negative (-) Acceleration
v(m/s) 8 6 4 2 0 -2 -4 t (s) 2 4 6 8 10 12 v-t graphs Constant + accel (slowing down) At rest Constant - Vel Constant negative accel (speeding up) Constant negative accel (slowing down) Constant + Vel (constant speed) Constant + accel (speeding up)
v(m/s) 8 6 4 2 0 -2 -4 t (s) 2 4 6 8 10 12 -2 m/s How to get the velocity (v) at a certain time off a v-t graph Example: What is the velocity at t = 8 seconds? Go over to t = 8. Find the pt on the graph. Find the v value for this time.
v(m/s) 8 6 4 2 0 -2 -4 2 4 6 8 10 12 Finding the average acceleration on a v-t graph Example: What is the average acceleration between 0 & 2, 2 & 4, and 4 & 10 seconds? a0-2 = (v2 – v1) / Dt = rise / run = +4/2 = +2 m/s2 A2-4 = (v2 – v1) / Dt = rise / run = 0 m/s2 A4-10 = (v2 – v1) / Dt = rise / run = -7 / 6 = -1.17 m/s2
The slope of the tangent to the curve at any point is the INSTANTANEOUS acceleration Slope of any segment is the AVERAGE acceleration v (m/s) v-t graphs t (sec) t0 t1
3 Open to in your Unit 1 packet 30 20 10 0 -10 -20 -30 v = -30 m/s s = 30 m/s a = slope = (-30 m/s) / 16sec = -1.875 m/s2 a = slope = (+57 m/s) / 32sec = +1.78 m/s2 (approx)
3 Open to in your Unit 1 packet 30 20 10 0 -10 -20 -30 3) 4) 5) You can’t say. You know its speed at the start, but not where it is Object is at rest whenever it crosses the t-axis t = 0, 36, 80 sec Const – accel (object speeds up), const – vel, const + accel (slows down), const + accel (speeds up), const – accel (slows down)
Day #6* v-t graphs * slopes & areas of v-t graphs * instantaneous accelerations
UNIFORM Velocity Speed increases as slope increases x x x x x x x t t t t t t t Object at REST Moving forward or backward x-t‘s Object Positively Accelerating Changing Direction Object Speeding up Object Negatively Accelerating
v v v v v t t t t t UNIFORM Positive (+) Acceleration Acceleration increases as slope increases Changing Direction v-t‘s UNIFORM Velocity (no acceleration) Object at REST UNIFORM Negative (-) Acceleration
A Quick Review • The slope between 2 points on an x-t graph gets you the _______________. • The slope at a single point (the slope of the tangent to the curve) on an x-t graph gets you the ____________. • The slope between 2 points on a v-t graph gets you the ____________. • The slope at a single point (the slope of the tangent to the curve) on a v-t graph gets you the ____________. Average velocity Inst. velocity Avg. accel. Inst. accel.
v v t t NEW CONCEPT When you find the area “under the curve” on a v-t graph, this gets you the displacement during the given time interval. The “area under the curve” is really the area between the graph and the t-axis. This is NOT the area under the curve
v t The displacement during the first 4 seconds is -20m A = ½ (4)(-10) = -20m Find the area under the curve from …. • 0-4 seconds. • 4-6 • 6-10 • 0-10 A = ½ (2)(-10) = -10m The displacement during the next 2 seconds is -10m A = ½ (4)(15) = 30m The displacement during the next 4 seconds is 30m 15 -10 A = -20 + (-10) + 30 = 0m 4 6 10 The OVERALL displacement from 0 to 10 seconds is zero (its back to where it started)
v(m/s) 8 6 4 2 0 -2 -4 12 m + 4 m = 16 m Find the positive area bounded by the “curve” t (s) 2 4 6 8 10 12 Find the negative area bounded by the “curve” (-2.25 m) + (-4.5 m) = - 6.75 m How to find the displacement from one time to another from a v-t graph Example: What is the displacement from t = 2 to t = 10? Add the positive and negative areas together Dx = 16 m + (-6.75 m) = 9.25 m
v(m/s) 8 6 4 2 0 -2 -4 12 m + 4 m = 16 m Find the positive area bounded by the “curve” t (s) 2 4 6 8 10 12 Find the negative area bounded by the “curve” (-2.25 m) + (-4.5 m) = - 6.75 m How to find the distance traveled from one time to another from a v-t graph Example: What is the distance traveled from t = 2 to t = 10? Add the MAGNITUDES of these two areas together distance = 16 m + 6.75 m = 22.75 m
v(m/s) 8 6 4 2 0 -2 -4 12 m + 4 m = 16 m The DISPLACEMENT is simply the area “under” the curve. Dx = 16 m + (-6.75 m) = 9.25 m t (s) 2 4 6 8 10 12 (-2.25 m) + (-4.5 m) = - 6.75 How to find the average velocity during a time interval on a v-t graph Example: What is the average velocity from t = 2 to t = 10? The AVG velocity = Dx / Dt = 9.25 m / 8 s = 1.22 m/s
v(m/s) 8 6 4 2 0 -2 -4 4 m 12 m + 4 m = 20 m The DISPLACEMENT during the 1st 10 sec is simply the area “under” the curve. Dx = 20 m + (-6.75 m) = 13.25 m t (s) 2 4 6 8 10 12 (-2.25 m) + (-4.5 m) = - 6.75 How to find the final position of an object using a v-t graph (and being given the initial position) Example: What is the final position after t = 10 seconds if xi = 40 m? Dx = x2 – x1 x2 = Dx + x1= 13.25 m + 40 m = 53.25 m
The slope of the tangent to the curve at any point is the INSTANTANEOUS acceleration The area under the curve between any two times is the CHANGE in position (the displacement) during that time period. Slope of any segment is the AVERAGE acceleration v (m/s) v-t graphs t (sec) t0 t1
3 Open to in your Unit 1 packet 30 20 10 0 -10 -20 -30 6) 7) Distance travelled = |area| = | ½ (16)(-30) | = 240m s = d/t = 240 m / 16 sec = 15 m/s Displacement = |area| = ½ (16)(-30) + 8 (-30) = -480m v = Dx/t = -480 m / 24 sec = -20 m/s
3 Open to in your Unit 1 packet 30 20 10 0 -10 -20 -30 8) Find all the areas “under the curve” from 0 to 44 sec Area = ½ (16)(-30) + 12(-30) + ½ (8)(-30) + ½ (8)(30) = - 600 m Area = Dx = - 600 m Dx = x2 – x1 -600m = x2 – (-16m) x2 = - 616m
4 Open to in your Unit 1 packet +3.3 m/s2 +10 m/s 0 m/s +75 m
10 -10 5 -2 m/s2 0 m 50 m 30 m
9) 10) 11) 12) 13) 14 & 34 sec +.35 m/s2 + 8 m/s + 2 m/s2 approx 0.8 m/s2