Download
1 / 5
50 likes | 157 Views
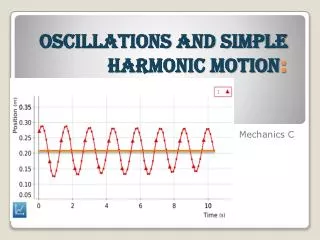
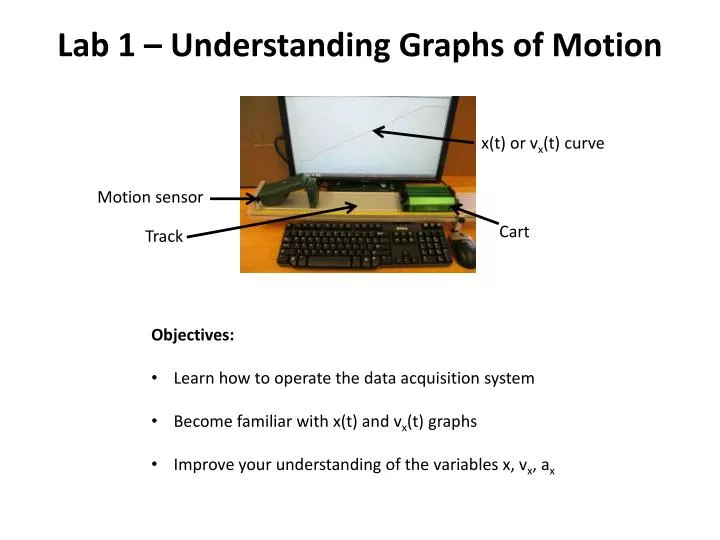
x (t) or v x (t) curve. Lab 1 – Understanding Graphs of Motion. Motion sensor. Cart. Track. Objectives: Learn how to operate the data acquisition system Become familiar with x(t) and v x (t) graphs Improve your understanding of the variables x, v x , a x. Part I – Experimental Set-up.

E N D
x(t) or vx(t) curve Lab 1 – Understanding Graphs of Motion Motion sensor Cart Track • Objectives: • Learn how to operate the data acquisition system • Become familiar with x(t) and vx(t) graphs • Improve your understanding of the variables x, vx, ax
Part I – Experimental Set-up Start x t +x direction Motion sensor Cart Track Set up the equipment as shown here. The motion sensor should be connected to the interface box, which in turn should be connected to the computer.
Part I – Experimental Set-up Start x t +x direction Motion sensor Cart Track Move the cart so as to try to match the template. Detailed instructions are given online.
Lab 1 submission Make sure to submit the Lab 1 worksheet at the right link.
Reminders • Objectives: • Learn how to operate the data acquisition system • Become familiar with x(t) and vx(t) graphs • Improve your understanding of the variables x, vx, ax