Download
1 / 19
240 likes | 501 Views
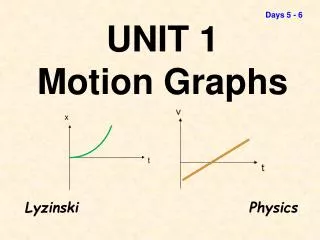
Days 7 - 10. UNIT 1 Motion Graphs. x. t. Lyzinski Physics. Day #7 * a-t graphs * “THE MAP”. UNIFORM Velocity. Speed increases as slope increases. x. x. x. x. x. x. x. t. t. t. t. t. t. t. Object at REST. Moving forward or backward. x-t ‘s.

E N D
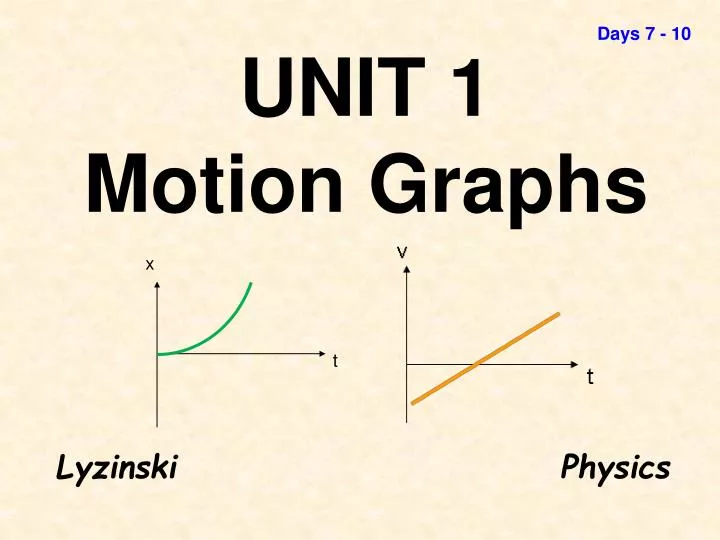
Days 7 - 10 UNIT 1Motion Graphs x t Lyzinski Physics
UNIFORM Velocity Speed increases as slope increases x x x x x x x t t t t t t t Object at REST Moving forward or backward x-t‘s Object Positively Accelerating Changing Direction Object Speeding up Object Negatively Accelerating
v v v v v t t t t t UNIFORM Positive (+) Acceleration Acceleration increases as slope increases Changing Direction v-t‘s UNIFORM Velocity (no acceleration) Object at REST UNIFORM Negative (-) Acceleration
a a t t UNIFORM Acceleration a-t‘s UNIFORM Velocity OR An Object at REST
Graph Re-Cap Average velocity Instantaneous Velocity Average acceleration Instantaneous acceleration JERK!!!!!!!!!!! (no jerks on test ) x-t Tells you nothing Area under curve v-t Displacement (Dx) a-t Change in velocity (Dv)
a (m/s2) a-t graphs t (sec) t0 t1 Slopes???? The area under the curve between any two times is the CHANGE in VELOCITY during that time period. No jerks on test
AREA v-t a-t x-t SLOPE THE MAP!!!! Dx Dv “3 towns, 4 roads”
5 Open to in your Unit 1 packet 1) 2) a = 6 m/s2 Dv = area = 4 (6) + (2.5 * -9) = 1.5 m/s
5 Open to in your Unit 1 packet 3) 4) Dv = area = 2.5 (6) = 15 m/s Dv = v2 – v1 v1= (-5) – 15 = -20 m/s Either at rest or at a constant velocity, const + accel, const – accel, non-constant – accel, non-constant + accel
v x t t Day #10Given x-t or v-t graphs, draw the corresponding v-t or x-t (or even a-t) graph.
4m 24m 40m 18m 3m 0m - 18m -10m Drawing an x-t from a v-t Find the area under the curve in each interval to get the displacement in each interval v (km/hr) 8 4 0 -4 -8 t (hr) 4 8 12 16 20 24 28 Use these displacements (making sure to start at xi, which should be given) to find the pts on the d-t curve x (km) 80 60 40 20 0 “Connect the dots” and then CHECK IT!!!! t (hr) 4 8 12 16 20 24 28
6 yd/min -4 yd/min 0 yd/min Plot these slopes (which are average velocities) + accel. region (+ slope) For curved d-t regions, draw a sloped segment on the v-t This only works if the accelerations on the x-t graph are assumed to be constant Drawing a v-t from an x-t x (yd) Find the slope of each “Non-curved” interval 40 30 20 10 0 -10 -20 t (min) 10 20 30 40 50 v (yd/min) 6 4 2 0 -2 -4 -6 t (min) 10 20 30 40 50