Download
1 / 34
340 likes | 554 Views
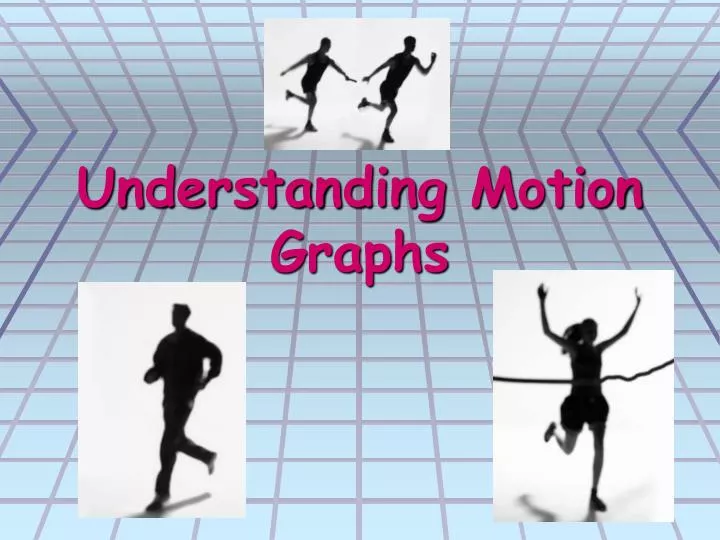
Understanding Motion Graphs. Speed is Distance Over Time Song. http://www.teachertube.com/viewVideo.php?video_id=118880&title=Mr__D___Edmonds___Speed_Is_Distance_Over_Time_Song. Speed Equals Distance Over Time Video Clip.

E N D
Speed is Distance Over Time Song http://www.teachertube.com/viewVideo.php?video_id=118880&title=Mr__D___Edmonds___Speed_Is_Distance_Over_Time_Song
Speed Equals Distance Over Time Video Clip http://videos.howstuffworks.com/hsw/13150-discovering-math-speed-and-distance-video.htm
Interpreting Graphs • Look at what each axis represents • Describe the motion represented by each part of each line. • The steepest increasing line is the fastest motion. • Horizontal lines represent no change in position. • A decreasing line means backwards movement
70 60 Fast, steady speed. speeding up. 50 Distance (m) 40 Not moving steady speed. 30 Moving backwards 20 10 0 15 25 30 35 5 10 20 40 45 50 Time (sec)
Calculating Speed on a Graph • Use the formula for speed Speed = Distance ÷ Time
Calculating Speed on a Graph 2. Find the total distance from the graph. Speed = Distance ÷ Time
70 60 Fast, steady speed. speeding up. 50 Distance (m) 40 Not moving steady speed. 30 Moving backwards 20 10 0 15 25 30 35 5 10 20 40 45 50 Time (sec)
Calculating Speed on a Graph 2. Find the total distance from the graph. Speed = Distance ÷ Time Speed = 70 m÷ Time
Calculating Speed on a Graph 3. Find the time it took to travel that distance from the graph. Speed = Distance ÷ Time Speed = 70 m÷ Time
70 60 Fast, steady speed. speeding up. 50 Distance (m) 40 Not moving steady speed. 30 Moving backwards 20 10 0 15 25 30 35 5 10 20 40 45 50 Time (sec)
Calculating Speed on a Graph 3. Find the time it took to travel that distance from the graph. Speed = Distance ÷ Time Speed = 70 m÷ 15 sec Speed = 4.7 m/sec
Albert, Bob and Charlie ran the 100 meter dash. Use the graph to answer the following questions.
Which runner won the race? Hint: Which line is the steepest?
Which runner won the race? Hint: Which line is the steepest? • Albert 2. Which runner took a break or stopped running during the race?
Which runner won the race? Hint: Which line is the steepest? • Albert 2. Which runner took a break or stopped running during the race? • Charlie
3. How long did Charlie stop? • About 5 seconds 4. What was his speed before he stopped?
3. How long did Charlie stop? • About 5 seconds 4. What was Charlie’s speed before he stopped? • Speed = 50 m ÷ 8 sec • Speed = 6.3 m/sec
5. What was Albert’s average speed for the race? • Speed = 100 m ÷ 12 sec • Speed = 8.3 m/sec
6. What was Bob’s average speed for the race? • Speed = 100 m ÷ 14 sec • Speed = 7.1 m/sec
7. What was Charlie’s average speed for the race? • Speed = 100 m ÷ 17 sec • Speed = 5.9 m/sec
Reminder: • Study vocabulary cards.