Download
1 / 22
220 likes | 326 Views
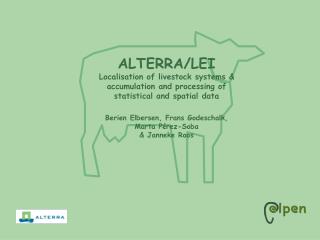
Use of national data to improve the localisation of livestock. Marta Pérez-Soba Han Naeff Janneke Roos Wim Nieuwenhuizen Alterra, The Netherlands Haarlem, 22nd March 2002. Where are the different livestock types geographically located?. Biophysical features. Land cover: CORINE 43.

E N D
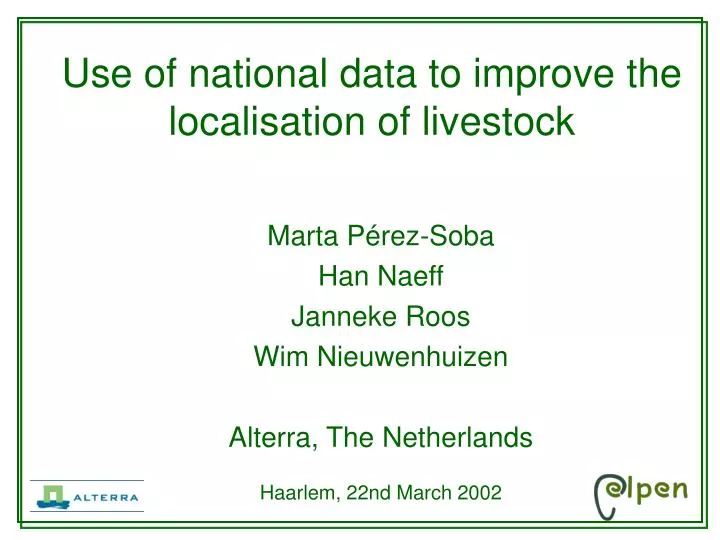
Use of national data to improve the localisation of livestock Marta Pérez-Soba Han Naeff Janneke Roos Wim Nieuwenhuizen Alterra, The Netherlands Haarlem, 22nd March 2002
Where are the different livestock types geographically located?
Biophysical features Land cover: CORINE 43 Others: altitude, soils, climate Selection land cover classes Allocation maps (European approaches) Validation: geo-referenced national/regional databases Conclusions for the ELPEN system Where are the livestock systems located?
CORINE Land cover Scale 1:100.000, 43 classes Minimum mapping element: 25 ha
Validation ofEuropean approach 5 From the 43 CORINE classes we selected 8 classes: • pastures • land principally occupied by agriculture • annual crops associated with permanent crops • complex cultivation patterns • moors and heath lands • natural grasslands • agro-forestry areas • non-irrigated arable land (10%)
For the validation we distinguished 4 land-dependent livestock categories Example: The Netherlands
Questions to be answered • How (in)accurate is the allocation procedure of approach 5: • Inaccuracy caused by chosen regional level? • Inaccuracy caused by chosen land cover classes? By applying the ELPEN algorythm of approach 5 to the same Dutch data, we ruled out inaccuracies caused by different data sets
Data aggregated grid 5x5 Data aggregated at three regional levels Province (12) Giab-2000 Grid 5x5 km2 Agricultural regions (66) Municipalities (500) Our reference Data aggregated grid 5x5 according to ELPEN algorythm Validation (in)accuracy regional level Geo-referenced Giab-2000 farm data
Levels we used for validation Provincial level Municipality level Agricultural regions
Nr. of dairy cows LU:1 - 10 10 - 30 30 - 60 60 - 100 100- 200 200- 350 350- 600 600-2500 2500-5000 Nr. of livestock farms:1 - 10 11 - 50 51 - 100 101 - 212 no data Our reference maps: GIAB 2000 Geo-referenced Giab-2000 farm data : aggregated at 5x5 km grid
Geo-referenced Giab-2000 farm data Data aggregated at regional levels Data aggregated 5x5 km grid according to ELPEN algorithm Nr. of dairy cows LU:1 - 10 10 - 30 30 - 60 60 - 100 100- 200 200- 350 350- 600 600-2500 2500-5000 Giab-2000 Grid 5x5 km2 Our reference Province (12) Municipalities (500) Inaccuracy caused by regional level: dairy cows
Results comparison GIAB - Elpen algorithm Dairy: aggregated / Province Dairy: aggregated / Municipality Green: too many dairy cows in ELPEN approach (-2000 - -50 LU) Gray : approximately correctRed : too few dairy cows in ELPEN approach(50 - 2000 LU)
Results comparison GIAB - Elpen algorithm Sheep/goat: aggregated / Province Sheep/goat: aggregated / municipality Green: too many sheep in ELPEN approach (-400 - -10 LU)Gray : approximately correctRed : too few sheep in ELPEN approach (10 - 400 LU)
Validation of Corine classes • Procedure: • Overlay GIAB farm data with Corine 100 x 100m(derived from polygon map with smallest area of 25 ha) • Analyse which Corine classes are relevant • Define a methodology to improve localisation: • Calculate livestock density / Corine class / province • Derive relative attractivity for the different livestock types of each Corine class per province • Derive better rules for localisation in ELPEN
Overlay GIAB farm data with CORINE 100 x 100m • Farm 203 • nr of dairy cows: 40 • nr of sheeps: 100 • fodder area: 25 ha • pasture area: 30 ha • cadastral area: 60 ha • etc
Overlay GIAB farm data with CORINE 100 x 100m Example of error due to lack of data on location of farm land:In Groningen is only onesmall area of Annual crops. Most of the farm land of the3 farms within this area might be outside this Corine class, but is computed as being inside. Error due to use of farm address instead of location of farm land(not available yet): Many (post) addresses of farms are in urban areas
Livestock density (LU/ha) per Corine class per province <------ Provinces -----> Conclusion: Pastures: mostly highest density per livestock type per provinceLand pp occ agr: in most provinces too small area, density in betweenComplex cult pt:In some provinces high density, in others lowNon-irr ar land: mostlylowest density per livestock type per province
Dairy/Bovinearea Dairy/Bovinearea Dairy cowsandSheep area Livestock density (LU/ha) per Corine class per province
Livestockpasturearea Dairy +sheeparea Bovinearea Other cowsarea Livestock density (LU/ha) per Corine class per province
What can we do with these results? • From the overlay of national data (2000) with Corine we know: • The approximate livestock density of each corine class per livestock type, per province • From this we can derive: • The relativeattractivity of each corine class per livestock type, per province • Restrictionson the nr of LU/ha to be allocated per Corine class per livestock type, per province • Attractivity and Restrictionsare input for the new allocation procedure: approach 6, that has been implemented in the ELPEN system
New allocation procedure: Approach 6: Competition for grassland
National statisticaldata on livestock Knowledge rules Climate map Corine land use map Altitude map Attractivity map bovine Allocation map bovine Attractivity map sheep Allocation map sheep Attractivity map dairy Allocationproc. 6 Allocation map dairy restriction map bovine restriction map sheep restriction map dairy European statisticaldata on livestock Allocation procedure Approach 6