Download
1 / 58
580 likes | 824 Views
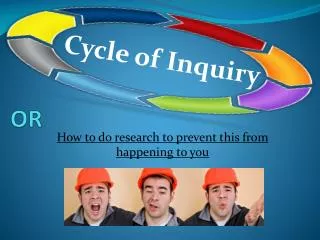
Exploring the Use of Data Inquiry Cycle to Improve Student Learning. Outcomes: Develop a common understanding of the data inquiry cycle Explore examples of how the inquiry cycle is currently being used in Brighton Self-assess the incorporation of the cycle into the work of our building.

E N D
Exploring the Use of Data Inquiry Cycle to Improve Student Learning Outcomes: • Develop a common understanding of the data inquiry cycle • Explore examples of how the inquiry cycle is currently being used in Brighton • Self-assess the incorporation of the cycle into the work of our building
What do we know about data? • “the compelling evidence that grounds conclusions in actual results, not speculation” (Love, 2009) • “Information output by a sensing device or organ that includes both useful and irrelevant information” (Webster) Regardless of definition, data – by themselves – have no meaning.
Descriptive information on: • Enrollment • Attendance • Special Education/ • Dropout rate • Ethnicity • Gender • Grade level • Language proficiency
What students, parents, teachers, etc. think about and/or their attitudes related to: • Learning environment • Classes • School
Results of: • Standardized tests • Unit tests • Grades in a course of study • Formative assessments • Authentic assessments
Description of: • School programs and processes • Instructional strategies • Classroom practices
Poor Attendance Disengaged in class Poor Grades High Test Scores
Instructional Decisions We use data for two purposes: • make informed decisions about instruction • provide feedback to students about their learning • prioritize and focus energies around student learning • gain an understanding of what a quality performance is and how close our students are to achieving it • identify students who need enrichment and those who need support • measure program effectiveness • refine curriculum Using data is a key tool in leading schools toward improvement. Program Decisions
What’s going on at a district level? • Data Days • Analysis of upcoming students to see patterns of strengths and weaknesses
What’s important to consider when implementing the data inquiry cycle? • Focus • Assessment • Analysis Process • Actions
What should the focus of the work be? Knowledge, understandings and skills: • critical to the discipline • necessary for career and college readiness • essential life outside of school • used as building blocks for the next grade level • aligned with “What makes Brighton Brighton?” • teachers will see value in collaborating around • students engage with because have repeated opportunities for feedback and improving
What assessments will be used to guide the inquiry? • Standardized tests • Summative tests • Common assessments • Interim assessments • Classroom formative assessments
What is the quality of the assessment? Little Red Riding Hood This story is mainly about: Little Red Riding Hood’s journey through the woods The pain of losing your grandmother Everything is not always what it seems Fear of wolves What is the main idea? This story is mainly about: • Two boys fighting • A girl playing in the woods • Little Red Riding Hood’s adventures with a wolf • A wolf in the forest from Bambrick-Santoyo’sDriven by Data
Are the assessments used aligned with standards, curriculum, the development of disciplinary expertise and the focus of your work? Focus: Comprehension DIBELS – ??? Running Reading Record - ??? Commercially Produced Assessment - ??? Teacher Designed - ???
What matters with respect to analysis & implementation? • Time to dedicate to the work • Timeliness • Protocols • Implementation - strategies are defined to move student learning forward • Reflections on process & progress
Goals for AIS at TCMS 2011-2012 • Use data to identify students’ needs and match intervention to the student need • Wanted to have “tiers” of intensity to match student need and to maximize resources • Wanted to be able to progress monitor student growth to move students up and down the “tiers” as needed
Analyze Data to Define Strengths and Weaknesses • Over the summer used MAP data and ELA data to try to “tier” students (greatest need, lesser need) • Created intervention groups • Greatest need: Reading teachers, smaller classes • Lesser need: Classroom-based AIS providers, larger groups
Identify What You Need to Focus On • AIS providers continued to use MAP data as well as ELA data to analyze student performance • Additionally, used benchmark assessments and individually-administered reading assessments to further pinpoint areas of need (QRI, Fountas and Pinnell Assessment, DRA 2+, DSA)
Define Strategies to Address Needs • Classroom-based AIS providers now providing skills based intervention based on individual assessments (as opposed to supporting ELA classroom instruction) • Interventions are based on assessments and not necessarily classroom ELA instruction • Interventions take place at students’ instructional levels
Implement Strategies • Students receive interventions every other day • Because interventions are based on student need, teachers can spend as much time as needed to ensure that students make growth • The tiering of students makes for more homogeneous instruction and allows for more efficient use of time
Monitor Progress as Related to Student Needs • Created an exit/entrance criteria document to be able to move students through the “tiers” • Will look at progress-monitoring data to help inform us as to which data (or combination of data) is best predictor of ELA assessment success
Next Steps • Evaluate Entrance/Exit criteria document • Analyze assessment data • Inform teachers of AIS process • Continue to work at maximizing resources to match student needs with the available resources
FRES Data Inquiry
The Inquiry Process… SWAC – School Wide Assessment Committee • Learning to use the data (MAP/AIMSweb/F&P/DSA/State/Math Pre&Post, etc.) • Thinking about what can be learned about our program from the data • Encouraging staff to use the data we have to plan for targeted instruction and ultimately improve student achievement • Discoveries have been passed to FRES committees (Math, ELA) for further exploration