Download
1 / 33
330 likes | 447 Views
ALTERRA/LEI Localisation of livestock systems & accumulation and processing of statistical and spatial data Berien Elbersen, Frans Godeschalk, Marta Pérez-Soba & Janneke Roos. Main activities. Improve allocation livestock systems Collect and process statistical and spatial data

E N D
ALTERRA/LEI Localisation of livestock systems & accumulation and processing of statistical and spatial data Berien Elbersen, Frans Godeschalk, Marta Pérez-Soba & Janneke Roos
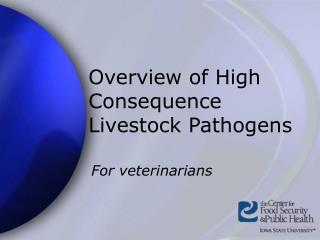
Main activities • Improve allocation livestock systems • Collect and process statistical and spatial data • ELPEN system building (with Object Vision)
Biophysical information Statistical information Land cover: CORINE 43 Land cover: PELCOM 13 Regional level: Statistical data Selection 8 CORINE classes or Grassland class of PELCOM First location maps: 5 km2 grids Validation by experts Greece meeting Allocation Where are the land dependent livestock systems located?
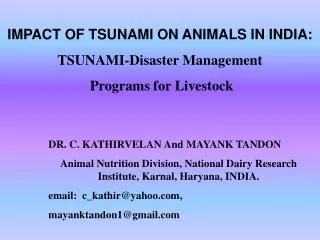
Allocation Outcome validation of maps in Greece • Location of animals, especially dairy cows, corresponded well with experts knowledge • Improvement through: • utilisation of low level statistical data • utilisation of additional land use information if available • develop specific approach per country and region
Allocation Improvement allocation maps possible through: Statistical data: • Geo-referenced individual farm data (NL, GB, AU, DK). But privacy problems. • Community level statistical data (rest EU). But time consuming and shape files needed with community boundaries. Spatial data: • bio-physical data to improve interpretation of Corine and PELCOM land use information
Corine Pelcom Altitude Climate Soil suitability National/Regional specific allocation rules EU-HARM 2 data 1990/2000 Harmonised EU-wide allocation maps Harmonised EU-wide maps with national/regional specific allocation rules How to proceed with allocation? National low-level statistical data EU-HARM 2 data 1990/2000 National spatial land use and land cover information
Statistical data available in ELPEN system FSS data (regional data) at sub-regional level (Harm2) for 1990: • land use and livestock population (per Harm2) • Holdings, UAA, SGM (per farm type per Harm2) FADN data (farm data) at regional level (Harm1) for 1990/91 and 1997/98 (per Harm1, EU-farming type, environmental farming type): • land use, livestock population, outputs, production, income & capital structure • Holdings, UAA, SGM
Statistical data still to be implemented in ELPEN system 2001(1) FSS data (regional data) at regional level (Harm1) for 1990 and 1997: • land use and livestock population (per Harm1) • Holdings, UAA, SGM (per farm type per Harm1) FADN data (regional data) at regional level (Harm1) for 1990/91 and 1997/98 (per Harm1, EU-farming type, environmental farming type): • land use, livestock population, outputs, production, income & capital structure • Holdings, UAA, SGM
Statistical data still to be implemented in ELPEN system 2001(2) REGIO data (1990-1998?) • set of basic socio-economic indicators (per Harm1/2) • additional indicators indicated by the Greek ELPEN team Possibly additional national statistics
Spatial information available in ELPEN system • Shape files: Nuts 1, Nuts 2, Nuts 3, Harm 1, Harm 2 • Corine 44 land cover classes • Pelcom grassland • Mean elevation • Soil map • Soil suitability maps for grass and cereals
Soil suitability maps • Based on soil map • First exclude soil that are unsuitable e.g. saline soils, rocks, very stony soils • Secondly, land suitable for arable is also suitable for grass, but not always applicable the other way around • Suitability for grass and cereals determined on basis of 8 combined soil parameters: texture, slope, soils phase, dainage, rooting depth, salinity, alkalinity
Available spatial data still to be implemented General data: • Topographic information (population density, urban areas, infrastructure, water bodies, roads, rivers etc.) • Climatic information (30 years average data on precipitation, temperature) • Bio-geographical zonations of Europe (Emerald and DMeer) • Potential Natural Vegetation map (Bohn, 1996) • Corine biotopes
13 Ecological regions of DMeer N & C Boreal Boreal Mountains Continental hemi-boreal North Sea Atlantic Sub-continental hemi-boreal Central Europe Pannonian SE Plains Atlantic Plains Alps Thermo-Atlantic Mediterranean & thermo-nemoral mountains Sub-continental & midle mountains Mediterranean
Available spatial data still to be implemented Environmental data: • Critical loads for N and acidity for forests (1.0 longitude* 0.5 latitude) • NOx, NH3 & SO2 (1960-2010) (150*150 km) (EMEP) Still to be derived from soil, elevation, climate protected natural areas: • Critical loads for N for protected natural areas • Acidity sensitivity map • Erosion sensitivity map
New tree-structure of the ELPEN system • General Background • System • StatisticalData • ModelFarms • GeographicData • Allocation • Environment • Economic • Social • Cases
General (1) Background: Demo + meta-information on ELPEN System: info not interesting for users StatisticalData: FADN: aggregated according to EU-typologie year -> levels EU->HARM2 FSS: year -> levels EU->HARM2 REGIO: must be added year -> levels EU->NUTS3 Other ModelFarms: description of livestock systems
General (2) GeographicData AdmRegions: levels EU->NUTS3->NUTS4/5 Designated areas LandCover (now: Corine and Pelcom) Elevation Soil (soil suitability included) Water Climate Landscape ??
General (3) Allocation (basis: FSS, EU-typology) GrazingLS_1(approach 5 dairy, sheep/goat) GrazingLS_2 (approach 6) GrazingLS_I (Interactivapproach, later) OtherLS(pigs, chickens, etc, maybe later) ArableFarms(maybe later) AllFarms
Environment(specific environmental data independent of cases) Typology GrazingLS_1(Erlings typology) Year_1990-91 UsedData (data and knowledge to produce gridmaps) EnvType_Gridmaps Dairy Sheep/goat Year_1997-98 OtherLS(pigs, chickens etc) ArableFarms AllFarms Vulnerability data abiotic biotic Polution data
Economic (all specific economical data independent of cases) vulnerability for milk price reduction Social (all specific social data independent of cases) dependency of dairy Cases (answers to specific questions) Shifts in Dairy and impacts ...(add this year)
Planning October 2001-January 2002 (1) Improve allocation: • EU wide approach • Case studies with geo-referenced farm information (NL, DE, B, AU) • Case studies with data on community level (D, AU) • Case studies with national specific land use information
Planning October 2001-January 2002 (2) Statistical data: • Incorporate FSS data (Harm1) for 1990 and 1997 • Change FADN data into regional data (Harm1) for 1990/91 and 1997/98 • Collect and incorporate REGIO data
Planning October 2001-January 2002 (3) Spatial data: • Arrange permission to use and incorporate topographic information, climatic information, DMeer, Potential Natural Vegetation map and Corine biotopes • Visit RIOVM and incorporate critical loads for N and acidity for forests, and NOx, NH3 & SO2 (1960-2010) (150*150 km) (EMEP) • Discuss and possibly produce critical loads for N for protected natural areas, acidity and erosion (?) sensitivity maps
Planning October 2001-January 2002 (4) General: • Participate in environmental typology development and impact assessment • PR for ELPEN after 2002 (National and EU) • Links with other projects (Pastoral, EFNCP)
Planning October 2001-January 2002 (5) System building: -> Stabilize software ->Better system documentation: www.yusegso.nl/ObjectVision/DMS ?>Support of Concepts to build complex datastructures & Calculation Schemes !>Aggregation / disaggregation by Allocation- Schemes ?>Client/Server support
Planning October 2001-January 2002 (6) User Interface Components: ->Viewers: Histogram graphs; more interactive map-viewer with text-labels ?>Validation: Calculation Process-monitoring, tracing the calculation of individual values & statistics across the chain of calculation steps. ?>Web Server support ?> Insight in how indicators are defined/composed (Flow Charts/Mind Maps)
Planning October 2001-January 2002 (7) Configuration + Data: !>Configure remaining parts of 1st yr q + environmental stuff (al)location of competitive activities ?>Questions of the second year ?>Different types of indicators !>Case Management ->New integrated FSS+FADN implemented !>New configuration structure ?>Test and distribute system on short term
Conclusions & Issues • Users can make cases with existing calculation schemes, but modelling is still complicated. • Now: system with lots of basic data on different regional levels. Start with quality assurance and policy orientation. • To increase communication & co-operation, we should distribute the system & the ability to configure new calculation schemes & indicators.