Download
1 / 16
160 likes | 291 Views
Comparing Many Means. Statistics 2126. Introduction. We have talked about comparing two means You know, like is group 1 different from group 2 So you do a 2 sample t test, or perhaps in special cases a dependent sample t test and you find out the answer. However….

E N D
Comparing Many Means Statistics 2126
Introduction • We have talked about comparing two means • You know, like is group 1 different from group 2 • So you do a 2 sample t test, or perhaps in special cases a dependent sample t test and you find out the answer
However… • What if we had a situation where we had more than 2 groups, say 4 groups • How many t tests would you have to do? • 1 v 2 • 1 v 3 • 1 v 4 • 2 v 3 • 2 v 4 • 3 v 4 • Ok so that is a lot, what would it do to your Type I error rate?
Consider… • As noted the alpha level would increase, which would mean you would have to decrease it • So you lose power • Plus what about the overall pattern of differences? • Is the pattern of differences different than chance?
What do we need? • Beer, lots of beer.. • But before that we need a statistic that compares the overall amount of variation with the variation that you would expect due to chance (i.e., subject differences) • The question is, did this pattern of differences come about simply due to chance variation?
The hypotheses • H0 : μ1 = μ2 = μ3 =…= μk • Ha : at least two means differ • Now think about this, we will look at two measures of variation, overall variance vs. individual differences, how would we compare them?
How indeed… • Use a ratio of the two • Between group variation / within group variation • If the variation due to groups was simply by change what would this ratio equal? • 1 • If the groups differ it would be > 1
This ratio is called… • The F ratio • F is for Fisher • So we can use variance estimates to see if group means differ, cool eh? • E(F) = 1
Pretty simple • We divide between group variation by within group variation • This is called analysis of variance or ANOVA • Any score of any individual is made up of between group variation and within group variation
How do we calculate this? • We get sums of squares for between and within groups and divide by their degrees of freedom • Then we divide MSBG / MSWG • Gives us the F ratio which we compare to a critical value for F
The test itself • Compare the obtained F value to the critical value • The Critical value will have two sets of df, one for the numerator and one for the denominator
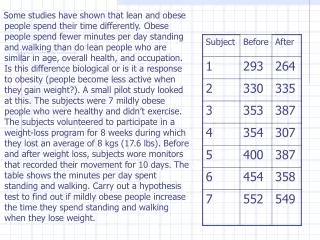
An example SSBG = 50 SSWG = 918
Compare to critical value • F(3,36) ~ F(3,30) = 2.92 • Well our obtained value is less than this so • We fail to reject H0 • If we did reject the null we just know two means differ, not which two • Post hoc tests take care of this
Assumptions • Normally distributed populations • SRS • Homogeneity of variance