Download
1 / 31
330 likes | 542 Views
Comparing Sample Means. Confidence Intervals. Difference Between Two Means. The point estimate for the difference is. Population means, independent samples. *. x 1 – x 2. σ 1 and σ 2 known. σ 1 and σ 2 unknown, n 1 and n 2 30. σ 1 and σ 2 unknown, n 1 or n 2 < 30.

E N D
Comparing Sample Means Confidence Intervals
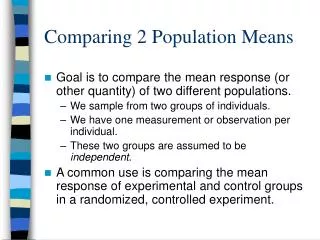
Difference Between Two Means The point estimate for the difference is Population means, independent samples * x1 – x2 σ1 and σ2 known σ1 and σ2 unknown, n1 and n2 30 σ1 and σ2 unknown, n1 or n2 < 30 AP Statistics
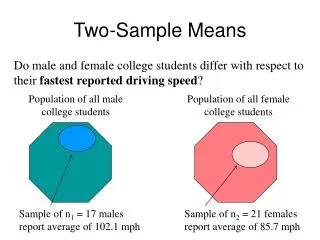
Independent Samples • Different data sources • Unrelated • Independent • Sample selected from one population has no effect on the sample selected from the other population • Use the difference between 2 sample means • Use z test or ttest Population means, independent samples * σ1 and σ2 known σ1 and σ2 unknown, n1 and n2 30 σ1 and σ2 unknown, n1 or n2 < 30 AP Statistics
σ1 and σ2 known Population means, independent samples • Assumptions: • Samples are randomly and independently drawn • population distributions are normal or both sample sizes are 30 • Population standard deviations are known * σ1 and σ2 known σ1 and σ2 unknown, n1 and n2 30 σ1 and σ2 unknown, n1 or n2 < 30 AP Statistics
σ1 and σ2 known When σ1 and σ2 are known and both populations are normal or both sample sizes are at least 30, the test statistic is a z-value… Population means, independent samples σ1 and σ2 known …and the standard error of x1 – x2 is σ1 and σ2 unknown, n1 and n2 30 σ1 and σ2 unknown, n1 or n2 < 30 AP Statistics
σ1 and σ2 known Population means, independent samples The confidence interval for μ1 – μ2 is: σ1 and σ2 known σ1 and σ2 unknown, n1 and n2 30 σ1 and σ2 unknown, n1 or n2 < 30 AP Statistics
σ1 and σ2 unknown, large samples • Assumptions: • Samples are randomly and independently drawn • both sample sizes are 30 • Population standard deviations are unknown Population means, independent samples σ1 and σ2 known σ1 and σ2 unknown, n1 and n2 30 σ1 and σ2 unknown, n1 or n2 < 30 AP Statistics
σ1 and σ2 unknown, large samples • Forming interval estimates: • use sample standard deviation s to estimate σ • the test statistic is a z value Population means, independent samples σ1 and σ2 known σ1 and σ2 unknown, n1 and n2 30 σ1 and σ2 unknown, n1 or n2 < 30 AP Statistics
σ1 and σ2 unknown, large samples Population means, independent samples The confidence interval for μ1 – μ2is: σ1 and σ2 known * σ1 and σ2 unknown, n1 and n2 30 σ1 and σ2 unknown, n1 or n2 < 30 AP Statistics
σ1 and σ2 unknown, small samples The confidence interval for μ1 – μ2 is: Population means, independent samples σ1 and σ2 known σ1 and σ2 unknown, n1 and n2 30 σ1 and σ2 unknown, n1 or n2 < 30 AP Statistics
You’re a financial analyst for a brokerage firm. Is there a difference in dividend yield between stocks listed on the NYSE & NASDAQ? You collect the following data: NYSENASDAQNumber 21 25 Sample mean 3.27 2.53 Sample stddev 1.30 1.16 Form a 95% confidence interval for the true mean. Example AP Statistics
Comparing Sample Means Hypothesis Tests
Hypothesis Tests forTwo Population Proportions Two Population Means, Independent Samples Lower tail test: H0: μ1μ2 HA: μ1 < μ2 i.e., H0: μ1 – μ2 0 HA: μ1 – μ2< 0 Upper tail test: H0: μ1≤μ2 HA: μ1>μ2 i.e., H0: μ1 – μ2≤ 0 HA: μ1 – μ2> 0 Two-tailed test: H0: μ1 = μ2 HA: μ1≠μ2 i.e., H0: μ1 – μ2= 0 HA: μ1 – μ2≠ 0 AP Statistics
Hypothesis tests for μ1 – μ2 Population means, independent samples Use a z test statistic σ1 and σ2 known Use s to estimate unknown σ , approximate with a z test statistic σ1 and σ2 unknown, n1 and n2 30 σ1 and σ2 unknown, n1 or n2 < 30 Use s to estimate unknown σ , use a t test statistic and pooled standard deviation AP Statistics
σ1 and σ2 known Population means, independent samples The test statistic for μ1 – μ2 is: σ1 and σ2 known σ1 and σ2 unknown, n1 and n2 30 σ1 and σ2 unknown, n1 or n2 < 30 AP Statistics
σ1 and σ2 unknown, large samples Population means, independent samples The test statistic for μ1 – μ2 is: σ1 and σ2 known σ1 and σ2 unknown, n1 and n2 30 σ1 and σ2 unknown, n1 or n2 < 30 AP Statistics
σ1 and σ2 unknown, small samples The test statistic for μ1 – μ2 is: Population means, independent samples σ1 and σ2 known σ1 and σ2 unknown, n1 and n2 30 σ1 and σ2 unknown, n1 or n2 < 30 AP Statistics
Hypothesis tests for μ1 – μ2 Two Population Means, Independent Samples Lower tail test: H0: μ1 – μ2 0 HA: μ1 – μ2< 0 Upper tail test: H0: μ1 – μ2≤ 0 HA: μ1 – μ2> 0 Two-tailed test: H0: μ1 – μ2= 0 HA: μ1 – μ2≠ 0 a a a/2 a/2 -za za -za/2 za/2 Reject H0 if z < -za Reject H0 if z > za Reject H0 if z < -za/2 or z > za/2 AP Statistics
You’re a financial analyst for a brokerage firm. Is there a difference in dividend yield between stocks listed on the NYSE & NASDAQ? You collect the following data: NYSENASDAQNumber 21 25 Sample mean 3.27 2.53 Sample stddev 1.30 1.16 Test the hypothesis that there is a difference in dividend yield. Example AP Statistics
Example P-value = .0285(2) = .057
Comparing Sample Means Matched Pair Comparisons
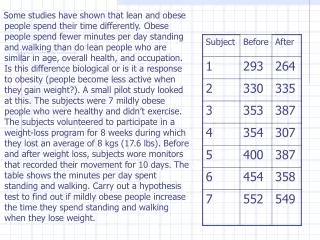
Paired Samples Tests Means of 2 Related Populations • Paired or matched samples • Repeated measures (before/after) • Use difference between paired values: • Eliminates Variation Among Subjects • Assumptions: • Both Populations Are Normally Distributed • Or, if Not Normal, use large samples Paired samples • d = x1 - x2 AP Statistics
Paired Differences The ith paired difference is di , where Paired samples • di = x1i - x2i The point estimate for the population mean paired difference is d : The sample standard deviation is n is the number of pairs in the paired sample AP Statistics
Paired Differences (continued) The confidence interval for d is Paired samples Where t/2 has n - 1 d.f. and sd is: n is the number of pairs in the paired sample AP Statistics
Hypothesis Testing for Paired Samples The test statistic for d is Paired samples n is the number of pairs in the paired sample Where t/2 has n - 1 d.f. and sd is: AP Statistics
Hypothesis Testing for Paired Samples (continued) Paired Samples Lower tail test: H0: μd 0 HA: μd < 0 Upper tail test: H0: μd≤ 0 HA: μd> 0 Two-tailed test: H0: μd = 0 HA: μd≠ 0 a a a/2 a/2 -ta ta -ta/2 ta/2 Reject H0 if t < -ta Reject H0 if t > ta Reject H0 if t < -ta/2 or t > ta/2 Where t has n - 1 d.f. AP Statistics
Paired Samples Example • Assume you send your salespeople to a “customer service” training workshop. Is the training effective? You collect the following data: Number of Complaints:(2) - (1) SalespersonBefore (1)After (2)Difference,di C.B. 64 - 2 T.F. 206 -14 M.H. 32 - 1 R.K. 00 0 M.O. 40- 4 -21 di d = n = -4.2 AP Statistics
Paired Samples: Solution • Has the training made a difference in the number of complaints (at the 0.01 level)? Reject Reject H0:μd = 0 HA:μd 0 /2 /2 = .01 d = - 4.2 - 4.604 4.604 - 1.66 Critical Value = ± 4.604d.f. = n - 1 = 4 Decision:Do not reject H0 (t stat is not in the reject region) Test Statistic: Conclusion:There is not a significant change in the number of complaints. AP Statistics