Download
1 / 1
10 likes | 171 Views
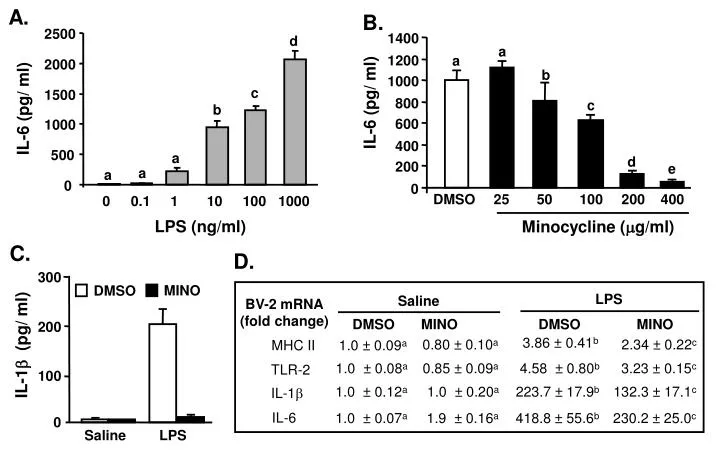
A. B. 1400. a. a. 1200. b. 1000. c. IL-6 (pg/ ml). 800. 600. 400. d. e. 200. 0. DMSO. 25. 50. 100. 200. 400. Minocycline ( m g/ml). C. 300. MINO. DMSO. 200. IL-1 b (pg/ ml). 100. 0. Saline. LPS. 2500. d. D. 2000. c. 1500. LPS. Saline. b. BV-2 mRNA

E N D
A. B. 1400 a a 1200 b 1000 c IL-6 (pg/ ml) 800 600 400 d e 200 0 DMSO 25 50 100 200 400 Minocycline (mg/ml) C. 300 MINO DMSO 200 IL-1b (pg/ ml) 100 0 Saline LPS 2500 d D. 2000 c 1500 LPS Saline b BV-2 mRNA (fold change) IL-6 (pg/ ml) 1000 DMSO MINO DMSO MINO MHC II 3.86 ± 0.41b 0.80 ±0.10a 2.34 ± 0.22c 1.0 ± 0.09a a 500 a a TLR-2 1.0 ± 0.08a 0.85 ± 0.09a 4.58 ± 0.80b 3.23 ± 0.15c 0 IL-1b 1.0 ± 0.12a 1.0 ± 0.20a 223.7 ± 17.9b 132.3 ± 17.1c 0 0.1 1 10 100 1000 IL-6 1.0 ± 0.07a 1.9 ± 0.16a 418.8 ± 55.6b 230.2 ± 25.0c LPS (ng/ml)