Download
1 / 22
220 likes | 355 Views
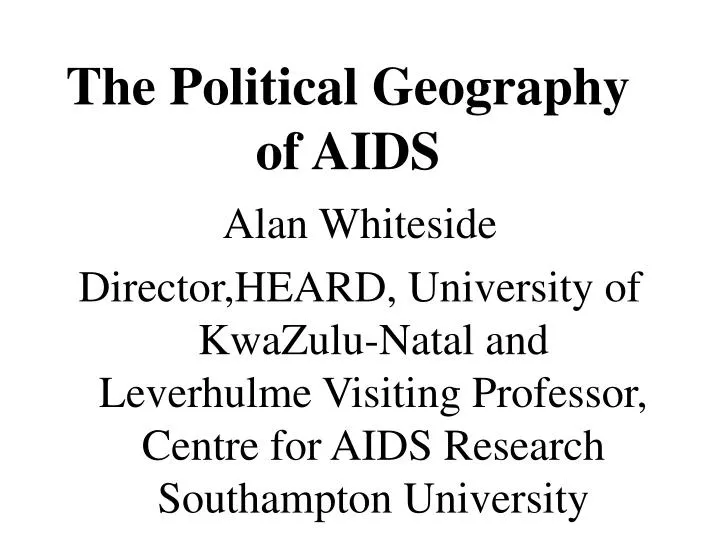
The Political Geography of AIDS . Alan Whiteside Director,HEARD, University of KwaZulu-Natal and Leverhulme Visiting Professor, Centre for AIDS Research Southampton University. Outline of presentation. Physical geography Economic geography Human geography Demography Development .

E N D
The Political Geography of AIDS Alan Whiteside Director,HEARD, University of KwaZulu-Natal and Leverhulme Visiting Professor, Centre for AIDS Research Southampton University
Outline of presentation • Physical geography • Economic geography • Human geography • Demography • Development
HIV prevalence in adults in sub-Saharan Africa, 1986-2001 1986 1991 20 – 39% 10 – 20% 5 – 10% 1 – 5% 0 – 1% trend data unavailable 1996 2001 outside region
HIV prevalence in adults in sub-Saharan Africa, end 2001 2001 20 – 39% 10 – 20% 5 – 10% 1 – 5% 0 – 1% trend data unavailable outside region
Outline of presentation • Physical geography • Economic geography • Human geography • Demography • Development
Wealth and HIV Botswana South Africa 3000 $ Namibia 2000 $ Swaziland 1000 $ Cote d’Ivoire Zimbabwe Uganda Zambia Per capita 1999 10 10 20 30 Adult HIV prevalence end 1999
World HIV Chart 2001 AIDS deaths per year Percent adults living with HIV (log) Zimbabwe Lesotho Botswana Swaziland 30 Zambia 300 000 Namibia Kenya 20 Malawi CentralAfrican Rep. 100 000 South Africa Cameroon 10 000 Mozambique Burundi 10 Côte d'Ivoire 1 000 Rwanda Sierra Leone Haiti 7 Angola Ethiopia Togo 5 Nigeria Equatorial Guinea Continents Uganda Dominican Rep. Burkina Faso Ghana Guinea- Bissau Chad Benin 3 Trinidad& Tobago Sudan Eritrea Guyana Africa Cambodia 2 Thailand Honduras Belize Americas Mali Panama Jamaica Barbados Suriname Ukraine Estonia 1 Guatemala PapuaNew Guinea Asia Russia Brazil United States of America Argentina El Salvador Nepal India Portugal Costa Rica 0.5 Europe Switzerland Spain Venezuela Malaysia Senegal Peru Madagascar Latvia Italy France Belarus Chile 0.3 Colombia Bahrain Cyprus Canada Ecuador Mexico Arab countries Nicaragua Singapore Uruguay Iceland 0.2 Armenia Greece Luxembourg Netherlands Denmark China Turkmenistan Pakistan Austria Egypt Maldives Cuba Belgium 0.1 Fiji Bolivia Malta Bhutan Israel Yemen Algeria Croatia Georgia Morocco Norway Turkey Tajikistan Jordan Hungary Slovenia Bulgaria Indonesia Mongolia Romania Finland Germany Sri Lanka Sweden Lithuania Azerbaijan Philippines Bangladesh Uzbekistan Japan Ireland New Zealand Czech Republic Mauritius United Kingdom Republic of Korea Australia 2 000 500 1 000 5 000 10 000 300 20 000 40 000 Annual income per person in US dollar (ppp & log)
World HIV Chart 2001 AIDS deaths per year Percent adults living with HIV (log) Zimbabwe Lesotho Botswana Swaziland 30 Zambia 300 000 Namibia Kenya 20 Malawi CentralAfrican Rep. 100 000 South Africa Cameroon 10 000 Mozambique Burundi 10 Côte d'Ivoire X200? 1 000 Rwanda Sierra Leone Haiti 7 Angola Ethiopia Togo 5 Equatorial Guinea Nigeria Continents Uganda Burkina Faso Ghana Guinea- Bissau Dominican Rep. Chad Benin 3 Sudan Eritrea Guyana Africa Trinidad and Tobago Cambodia 2 Belize Americas Thailand Mali Honduras Panama Jamaica Ukraine Estonia Suriname Barbados 1 PapuaNew Guinea Guatemala Asia Russia Brazil United States of America India Argentina Portugal Costa Rica El Salvador Nepal 0.5 Europe Spain Switzerland Venezuela Senegal Malaysia Latvia Italy Peru France Belarus Chile 0.3 Colombia Bahrain Cyprus Madagascar Canada Ecuador Mexico Arab countries Nicaragua Singapore Uruguay Iceland 0.2 Armenia Greece Luxembourg Netherlands Denmark Turkmenistan Pakistan China Austria Maldives Cuba Belgium Egypt 0.1 Fiji Bolivia Malta Bhutan Israel Yemen Algeria Croatia Georgia Morocco Norway Turkey Tajikistan Jordan Hungary Slovenia Bulgaria Indonesia Mongolia Romania Finland Germany Sri Lanka Sweden Lithuania Mauritius Azerbaijan Philippines Bangladesh Uzbekistan Japan Ireland New Zealand Czech Republic United Kingdom Republic of Korea Australia 2 000 500 1 000 5 000 10 000 300 20 000 40 000 Annual income per person in US dollar (ppp & log)
World HIV Chart 2001 AIDS deaths per year Percent adults living with HIV (log) Zimbabwe Lesotho Botswana Swaziland 30 Zambia 300 000 10 X 20 =200 Namibia Kenya 20 Malawi CentralAfrican Rep. 100 000 South Africa Cameroon 10 000 Mozambique Burundi 10 Côte d'Ivoire 1 000 Rwanda Sierra Leone Haiti 7 Angola Ethiopia Togo 5 Nigeria Continents Uganda Equatorial Guinea Burkina Faso Ghana Guinea- Bissau Chad Benin 3 Dominican Republic Sudan Eritrea Guyana Africa Cambodia Trinidad and Tobago 2 Belize Americas Thailand Mali Honduras Panama Jamaica Ukraine Estonia Suriname Barbados 1 Guatemala Asia Russia Brazil Papua New Guinea United States of America India Argentina Nepal Portugal Costa Rica El Salvador 0.5 Europe Spain Switzerland Venezuela Senegal Malaysia Latvia Italy Peru France Belarus Chile 0.3 Colombia Bahrain Cyprus Madagascar Canada Ecuador Mexico Arab countries Nicaragua Singapore Uruguay Iceland 0.2 Armenia Greece Luxembourg Netherlands Denmark Turkmenistan Pakistan China Austria Maldives Cuba Belgium Egypt 0.1 Fiji Bolivia Malta Bhutan Israel Yemen Algeria Croatia Georgia Morocco Norway Turkey Tajikistan Jordan Hungary Slovenia Bulgaria Indonesia Mongolia Romania Finland Germany Sri Lanka Sweden Lithuania Mauritius Azerbaijan Philippines Bangladesh Uzbekistan Japan Ireland New Zealand Czech Republic United Kingdom Republic of Korea Australia 2 000 500 1 000 5 000 10 000 300 20 000 40 000 Annual income per person in US dollar (purchasing power) Log
Outline of presentation • Physical geography • Economic geography • Human geography • Demography • Development
Total Orphans AIDS Orphans HIV Prevalence All orphans & orphans due to AIDS by HIV prevalence Uganda Total Number HIV Prevalence 2 million 12% 1.5 million 1 million 6% 0.5 million 0 0 Year 1985 1990 1995 2000 2005 2010
Estimated and projected deaths 15-34, with and without AIDS in South Africa: 1980-2025 2,000 Without AIDS With AIDS 1,600 1,200 Deaths (thousands) 800 400 0 1995-2000 1980-1985 2010-2015 1985-1990 2015-2020 2000-2005 1990-1995 2005-2010 2020-2025 Source: UN Department of Economic and Social Affairs (2002) World Population Prospects, the 2000 Revision
Predicted loss in life expectancy due to HIV/AIDS in children born in 2000 Predicted life expectancy Loss in life expectancy due to HIV/AIDS Botswana Zimbabwe South Africa Kenya Zambia Côte d'Ivoire Rwanda Mozambique Haiti Cambodia 0 10 20 30 40 50 60 70 Life expectancy at birth (years) Source: U.S. Census Bureau, 2000
Estimated increase in adult death rates relative to the 1985 rates
Outline of presentation • Physical geography • Economic geography • Human geography • Demography • Development
Changing life expectancy in African countries with high and low HIV prevalence: 1950-2005 Source:UNAIDS, 2002. Report on the global HIV/AIDS epidemic
80 Projected population structure in 2020 75 Males Females 70 65 Deficits due to AIDS 60 55 50 45 Age in years 40 35 30 25 20 15 10 5 0 140 120 100 80 60 40 20 0 0 20 40 60 80 100 120 140 Population (thousands) Projected Population Structure: Botswana 20202020 Source: US Census Bureau, World Population Profile 2000