Download
1 / 29
290 likes | 470 Views
Scintillometer and eddy covariance comparisons over sagebrush and invasive cheatgrass communities in Idaho EPSCoR Project Suported by NSF. Authors. University of Idaho – Wenguang Zhao, Rick Allen, Clarence Robison, Jeppe Kjaersgaard, Ricardo Trezza, Aureo Oliveira, Ramesh Dhungel

E N D
Scintillometer and eddy covariance comparisons over sagebrush and invasive cheatgrass communities in IdahoEPSCoR Project Suported by NSF
Authors University of Idaho – Wenguang Zhao, Rick Allen, Clarence Robison, Jeppe Kjaersgaard, Ricardo Trezza, Aureo Oliveira, Ramesh Dhungel Idaho State University – Matt Germino Boise State University – Venkat Sridhar Wageningen University – Henk de Bruin
Background 1. Sensible heat flux (H) is an important energy dissipation in surface energy balances and evapotranspiration (ET) studies. 2. Representation of H and ET measured by traditional methods (EC and BR etc) is limited, especially for heterogeneous fields. 3. Large aperture scintillometry (LAS) is an alternative method to estimate H from a relatively large footprint (source) area.
Questions 1. How can we accurately calculate H from the LAS measurement, structure function constant of refractive index fluctuations for the wavelength used by the LAS? 2. How does the H calculated by the LAS measurement compare to the traditional EC measurement result?
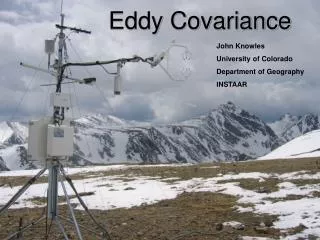
Experiment sites Mack’s Inn Site (Alpine Forest) Raft River Site (Cheatgrass) Hollister Site (Sage Brush)
LAS data (Cn2) H Four scenarios were used to calculate H from Cn2 : Scenario 1: Ta, u* and L from CSAT3 (RM Young); ET used in the Bowen Ratio correction for the LAS was from the EC. Calculate Ft, T* and H directly. Scenario 2: Ta and u* from CSAT3 (RM Young); ET used in the Bowen Ratio correction for the LAS was from EC. Calculate L, Ft, T* and H iteratively.
LAS data (Cn2) H Four scenarios were used to calculate H from Cn2 : Scenario 3: Ta and u from CSAT3 (RM Young; ET used in the Bowen Ratio correction for the LAS was from EC. Calculate u*, L, Ft, T* and H using TCLI method. Scenario 4: Measured Rn (NR01), G (HFT), Ta (HMP) and P (PTB110); u from CSAT3 (RM Young). Calculate u*, L, Ft, T*, H and ET iteratively (three-concentric-loop-iterative method). --- note this is the most generally used method.
Conclusions 1. Good agreement was obtained between H measured by CSAT3 and RM Young 81000 3-D sonic anemometers 2. H measured by Scintec BLS900 compared well with both EC systems (CSAT3 and RM Young). Thank you!