Download
1 / 20
220 likes | 588 Views
Correlation and Covariance. James H. Steiger. Goals for Today. Introduce the statistical concepts of Covariance Correlation Investigate invariance properties Develop computational formulas. Covariance.

E N D
Correlation and Covariance James H. Steiger
Goals for Today • Introduce the statistical concepts of • Covariance • Correlation • Investigate invariance properties • Develop computational formulas
Covariance • So far, we have been analyzing summary statistics that describe aspects of a single list of numbers • Frequently, however, we are interested in how variables behave together
Smoking and Lung Capacity • Suppose, for example, we wanted to investigate the relationship between cigarette smoking and lung capacity • We might ask a group of people about their smoking habits, and measure their lung capacities
Smoking and Lung Capacity • With SPSS, we can easily enter these data and produce a scatterplot.
Smoking and Lung Capacity • We can see easily from the graph that as smoking goes up, lung capacity tends to go down. • The two variables covary in opposite directions. • We now examine two statistics, covariance and correlation, for quantifying how variables covary.
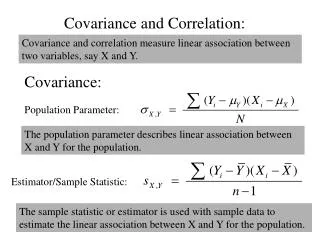
Covariance • When two variables covary in opposite directions, as smoking and lung capacity do, values tend to be on opposite sides of the group mean. That is, when smoking is above its group mean, lung capacity tends to be below its group mean. • Consequently, by averaging the product of deviation scores, we can obtain a measure of how the variables vary together.
The Sample Covariance • Instead of averaging by dividing by N, we divide by . The resulting formula is
Calculating Covariance • So we obtain
Invariance Properties of Covariance • The covariance is invariant under listwise addition, but not under listwise multiplication. Hence, it is vulnerable to changes in standard deviation of the variables, and is not scale-invariant.
Invariance Properties of Covariance • Multiplicative constants come straight through in the covariance, so covariance is difficult to interpret – it incorporates information about the scale of the variables.
The (Pearson) Correlation Coefficient • Like covariance, but uses Z-scores instead of deviations scores. Hence, it is invariant under linear transformation of the raw scores.
Computational Formulas -- Covariance • There is a computational formula for covariance similar to the one for variance. Indeed, the latter is a special case of the former, since variance of a variable is “its covariance with itself.”
Computational Formula for Correlation • By substituting and rearranging, you obtain a substantial (and not very transparent) formula for