Download
1 / 32
320 likes | 436 Views
The Firm and Cost Overheads. Costs in the short run. Total cost. A firm’s total cost of production is the opportunity cost of the owners. — everything they must give up in order to produce output. Explicit and implicit costs. Explicit costs.

E N D
The Firm and Cost Overheads
Costs in the short run Total cost A firm’s total cost of production is the opportunity cost of the owners — everything they must give up in order to produce output
Explicit and implicit costs Explicit costs 1. purchase of expendable inputs including labor time 2. purchase of capital services (usually rent or lease) Implicit costs 1. value of produced expendables (feed for a cattle producer) 2. value of services provided by owned capital including financial capital
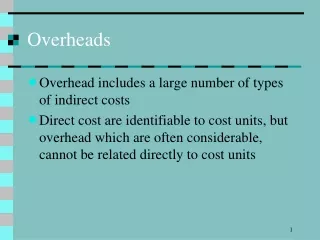
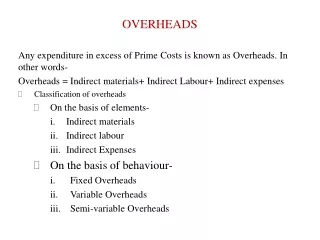
Operating costs and allocated overhead • 1. Costs of all expendables are often allocated • to the generic group OPERATING COSTS 2. All other costs are allocated to the group ALLOCATED OVERHEAD
Data for the hay hauling problem Cost of labor per hour = w1 = $6.00 Cost of tractor-wagon per hour = w2 = $20.00
Total fixed cost (TFC) The cost of all inputs that are fixed in the short run are called total fixed costs Assume that wagons hours is fixed at 1 For this example, then TFC = $20.00
TFC Graphical representation 100 Fixed Cost Curve Cost 80 60 40 20 0 0 400 800 1200 1600 2000 2400 Output - y
Fixed cost stays the same -- variable cost is rising Data on hay hauling x1 x2 TPP APP A MPP MPP TFC TVC TC AFC AVC ATC AMC MC 0.00 1.00 0.00 0.00 20.0 0.00 20.00 1.0 1.0 38.0 38.00 38.00 74.0 20.0 6.00 26.00 0.526 0.158 0.684 0.158 0.081 2.0 1.0 144.0 72.00 106.00 136.0 20.0 12.00 32.00 0.139 0.083 0.222 0.057 0.044 3.0 1.0 306.0 102.00 162.00 186.0 20.0 18.00 38.00 0.065 0.059 0.124 0.037 0.032
Data on hay hauling x1 x2 TPP APP A MPP MPP TFC TVC TC AFC AVC ATC AMC MC 0.00 1.00 0.00 0.00 20.0 0.00 20.00 1.0 1.0 38.0 38.00 38.00 74.0 20.0 6.00 26.00 0.526 0.158 0.684 0.158 0.081 2.0 1.0 144.0 72.00 106.00 136.0 20.0 12.00 32.00 0.139 0.083 0.222 0.057 0.044 3.0 1.0 306.0 102.00 162.00 186.0 20.0 18.00 38.00 0.065 0.059 0.124 0.037 0.032 4.0 1.0 512.0 128.00 206.00 224.0 20.0 24.00 44.00 0.039 0.047 0.086 0.029 0.027 5.0 1.0 750.0 150.00 238.00 250.0 20.0 30.00 50.00 0.027 0.040 0.067 0.025 0.024 6.0 1.0 1008.0 168.00 258.00 264.0 20.0 36.00 56.00 0.020 0.036 0.056 0.023 0.023 7.0 1.0 1274.0 182.00 266.00 266.0 20.0 42.00 62.00 0.016 0.033 0.049 0.023 0.023 8.0 1.0 1536.0 192.00 262.00 256.0 20.0 48.00 68.00 0.013 0.031 0.044 0.023 0.023 9.0 1.0 1782.0 198.00 246.00 234.0 20.0 54.00 74.00 0.011 0.030 0.042 0.024 0.026 10.0 1.0 2000.0 200.00 218.0 200.0 20.0 60.00 80.0 0.010 0.030 0.040 0.028 0.030 11.0 1.0 2178.0 198.00 178.0 154.0 20.0 66.00 86.0 0.009 0.030 0.039 0.034 0.039 12.0 1.0 2304.0 192.00 126.0 96.0 20.0 72.00 92.0 0.009 0.031 0.040 0.048 0.063 13.0 1.0 2366.0 182.00 62.0 26.0 20.0 78.00 98.0 0.008 0.033 0.041 0.097 0.231 14.0 1.0 2352.0 168.00 -14.0 -56.0 20.0 84.00 104.0 0.009 0.036 0.044
Total variable cost (TVC) Remember that the cost of all the inputs that are variable in the short run is called total variable cost For our example TVC(38) = $6.00
Data on hay hauling x1 x2 TPP APP A MPP MPP TFC TVC TC AFC AVC ATC AMC MC 0.00 1.00 0.00 0.00 20.0 0.00 20.00 1.0 1.0 38.0 38.00 38.00 74.0 20.0 6.00 26.00 0.526 0.158 0.684 0.158 0.081 2.0 1.0 144.0 72.00 106.00 136.0 20.0 12.00 32.00 0.139 0.083 0.222 0.057 0.044 3.0 1.0 306.0 102.00 162.00 186.0 20.0 18.00 38.00 0.065 0.059 0.124 0.037 0.032 And TVC (306) = $18.00
Data on hay hauling x1 x2 TPP APP A MPP MPP TFC TVC TC AFC AVC ATC AMC MC 0.00 1.00 0.00 0.00 20.0 0.00 20.00 1.0 1.0 38.0 38.00 38.00 74.0 20.0 6.00 26.00 0.526 0.158 0.684 0.158 0.081 2.0 1.0 144.0 72.00 106.00 136.0 20.0 12.00 32.00 0.139 0.083 0.222 0.057 0.044 3.0 1.0 306.0 102.00 162.00 186.0 20.0 18.00 38.00 0.065 0.059 0.124 0.037 0.032 4.0 1.0 512.0 128.00 206.00 224.0 20.0 24.00 44.00 0.039 0.047 0.086 0.029 0.027 5.0 1.0 750.0 150.00 238.00 250.0 20.0 30.00 50.00 0.027 0.040 0.067 0.025 0.024 6.0 1.0 1008.0 168.00 258.00 264.0 20.0 36.00 56.00 0.020 0.036 0.056 0.023 0.023 7.0 1.0 1274.0 182.00 266.00 266.0 20.0 42.00 62.00 0.016 0.033 0.049 0.023 0.023 8.0 1.0 1536.0 192.00 262.00 256.0 20.0 48.00 68.00 0.013 0.031 0.044 0.023 0.023 9.0 1.0 1782.0 198.00 246.00 234.0 20.0 54.00 74.00 0.011 0.030 0.042 0.024 0.026 10.0 1.0 2000.0 200.00 218.0 200.0 20.0 60.00 80.0 0.010 0.030 0.040 0.028 0.030 11.0 1.0 2178.0 198.00 178.0 154.0 20.0 66.00 86.0 0.009 0.030 0.039 0.034 0.039 12.0 1.0 2304.0 192.00 126.0 96.0 20.0 72.00 92.0 0.009 0.031 0.040 0.048 0.063 13.0 1.0 2366.0 182.00 62.0 26.0 20.0 78.00 98.0 0.008 0.033 0.041 0.097 0.231 14.0 1.0 2352.0 168.00 -14.0 -56.0 20.0 84.00 104.0 0.009 0.036 0.044
TVC Graphical representation of TVC 100 Total Variable Cost Cost 80 60 40 20 0 0 400 800 1200 1600 2000 2400 Output - y
Total cost (TC) The cost of all inputs used by the firm is called total costs Specifically, the sum of fixed and variable costs is called total costs TC = TFC + TVC
TFC TVC TC Graphical representation of total cost (TC) Total Cost Curves 100 Cost 80 60 40 20 0 0 400 800 1200 1600 2000 2400 Output - y
Average cost (AC) Average cost is just a total cost figure divided by the associated output level AC represents the average per unit cost of a given level of output There are average costs associated with each level of total costs
Average fixed cost is given by Average variable cost is given by Average (total) cost is given by
Data on hay hauling x1 x2 TPP(y) APP A MPP MPP TFC TVC TC AFC AVC ATC AMC MC 0.00 1.00 0.00 0.00 20.0 0.00 20.00 1.0 1.0 38.0 38.00 38.00 74.00 20.0 6.00 26.00 0.526 0.158 0.684 0.158 0.081 2.0 1.0 144 72.00 106.0 136.0 20.0 12.0 32.0 0.139 0.083 0.2220.057 0.044 3.0 1.0 306.0 102.00 162.00 186.00 20.0 18.00 38.00 0.065 0.059 0.124 0.037 0.032 4.0 1.0 512.0 128.00 206.00 224.00 20.0 24.00 44.00 0.039 0.047 0.086 0.029 0.027 5.0 1.0 750.0 150.00 238.00 250.00 20.0 30.00 50.00 0.027 0.040 0.067 0.025 0.024 6.0 1.0 1008.0 168.00 258.00 264.00 20.0 36.00 56.00 0.020 0.036 0.056 0.023 0.023 7.0 1.0 1274.0 182.00 266.00 266.00 20.0 42.00 62.00 0.016 0.033 0.049 0.023 0.023 8.0 1.0 1536.0 192.00 262.00 256.00 20.0 48.00 68.00 0.013 0.031 0.044 0.023 0.023 9.0 1.0 1782.0 198.00 246.00 234.00 20.0 54.00 74.00 0.011 0.030 0.042 0.024 0.026 10.0 1.0 2000.0 200.00 218.0 200.00 20.0 60.00 80.0 0.010 0.030 0.040 0.028 0.030 11.0 1.0 2178.0 198.00 178.0 154.00 20.0 66.00 86.0 0.009 0.030 0.039 0.034 0.039 12.0 1.0 2304.0 192.00 126.0 96.00 20.0 72.00 92.0 0.009 0.031 0.040 0.048 0.063 13.0 1.0 2366.0 182.00 62.0 26.00 20.0 78.00 98.0 0.008 0.033 0.041 0.097 0.231 14.0 1.0 2352.0 168.00 -14.0 -56.00 20.0 84.00 104.0 0.009 0.036 0.044
AFC Average Fixed Cost 0.8 Cost 0.7 0.6 0.5 0.4 0.3 0.2 0.1 0.0 0 400 800 1200 1600 2000 2400 Output - y
AVC Average Variable Cost 0.20 Cost 0.15 0.10 0.05 0.00 0 400 800 1200 1600 2000 2400 Output - y
AFC AVC ATC Average Cost Curves 0.40 Cost 0.30 0.20 0.10 0.00 0 400 800 1200 1600 2000 2400 Output - y Note that ATC = AVC + AFC
Marginal cost Marginal cost is the increment, or addition, to cost that results from producing one more unit of output The increase in total cost is the increase in variable cost In discrete or average terms marginal cost is given by
Marginal cost is just the derivative of the cost function with respect to y
Example calculation x1x2yTFCTVCTCAVE MC 0.0 1.0 0.0 20.0 0.00 20.00 1.0 1.0 38.0 20.0 6.00 26.00 0.158 2.0 1.0 144.0 20.0 12.00 32.00 0.057 3.0 1.0 306.0 20.0 18.00 38.00 0.037 4.0 1.0 512.0 20.0 24.00 44.00 0.029 5.0 1.0 750.0 20.0 30.00 50.00 0.025 6.0 1.0 1008.0 20.0 36.00 56.00 0.023
AVE MC Graphical representation of Marginal Cost 0.20 Cost 0.15 0.10 0.05 0.00 0 400 800 1200 1600 2000 2400 Output - y
AVE MC MPP 1 Relationship between MC & MPP (1 variable input) When MPP rises, MC falls When MPP falls, MC rises Marginal Cost Curve Marginal Product of Input 1 0.20 300 Cost Output - y 250 0.15 200 0.10 150 100 0.05 50 0.00 0 0 400 800 1200 1600 2000 2400 2 4 6 8 10 12 14 -50 Output - y Input - x 1
Average and marginal costs 1. When marginal cost is below the average cost, the average cost curve is falling 2. When the marginal and average costs are equal, the average cost curve does not change (is at minimum point) 3. When the marginal cost is greater than average cost, average cost is rising 4. The marginal cost curve will intersect AVC and ATC at their minimum points
AFC AVC ATC AVE MC Average and Marginal Cost Curves 0.3 Cost 0.2 0.1 0.0 0 400 800 1200 1600 2000 2400 Output - y
FC VC TC Cost curves for alternative function 500 450 Cost 400 350 300 250 200 150 100 50 0 0 10 20 30 40 Output - y
AFC AVC ATC AMC Average and Marginal Cost Curves 40 36 Cost 32 28 24 20 16 12 8 4 0 0 10 20 30 Output - y