Download
1 / 57
570 likes | 654 Views
The Firm and Profit Maximization Overheads. Neoclassical firm -. A neoclassical firm is an organization that controls the transformation of inputs (resources it owns or purchases) into outputs (valued products that it sells),. and earns the difference between what it receives

E N D
The Firm and Profit Maximization Overheads
Neoclassical firm - A neoclassical firm is an organization that controls the transformation of inputs (resources it owns or purchases) into outputs (valued products that it sells), and earns the difference between what it receives in revenue, and what it spends on inputs
We define the production function as y represents output f represents the relationship between outputs and inputs xj is the quantity used of the jth input (x1, x2, x3, . . . xn) is the input bundle n is the number of inputs used by the firm
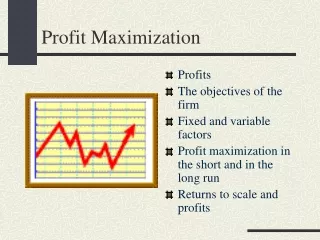
Returns (Profit) The profit from a production plan is the revenue obtained from the plan minus the cost of inputs used to implement it
Objectives of the firm We typically assume that a firm exists in order to make money A firm that wants to make money is called a for-profit firm, or a profit maximizing firm
Given the profit max assumption The firm maximizes the returns from the technologies it controls taking into account: The demandfor final consumption goods Opportunities for buying and selling factors / products The actions of other firms in the market
What is profit? Profit is revenue minus costs or
Explicit and implicit costs Explicit costs 1. purchase of expendable inputs including labor time 2. purchase of capital services (usually rent or lease) Implicit costs 1. value of produced expendables (feed for a cattle producer) 2. value of services provided by owned capital including financial capital and charges such as implicit rent, depreciation, compensation for operator labor, etc.
Accounting profit Accounting cost explicit costs + depreciation on plant & equipment Accounting profit total revenue - accounting cost
Economic profit Economic cost explicit costs + all implicit costs Economic profit total revenue - economic cost
Why do we use economic profit? To reflect total costs and revenues for a decision To account for all resources used in production
Why do profits exist? All factors of production receive a payment Expendables receive their market price Labor receives wages Land receives rent Capital receives interest Firm owners receive profits
What are profits? Profits are the returns to Risk Innovation production delivery new products
The Profit Maximizing Output Level Profit = Revenue - Cost = R - C
Demand The individual demand curve facing a firm tells us, for different prices, the quantity of output that customers will choose to purchase from the firm The demand curve facing the firm show us the maximum price the firm can charge to sell any given amount of output
Example Inverse Demands p = 320 - 20y p = $1.85
Total Revenue Revenue is the total income that comes from the sale of the output (goods and services) of a given firm or production process
YPriceFCVCCTRProfit 0.00 3201200.00 120.00 0-120.00 1.00 30012064.00 184.00 300116.00 2.00 280120130.00 250.00 560310.00 3.00 260120204.00 324.00 780456.00 4.00 240 120 292.00 412.00 960 548.00 5.00 220 120 400.00 520.00 1100 580.00
YPriceFCVCCTRProfit 0.00 3201200.00 120.00 0-120.00 1.00 30012064.00 184.00 300116.00 2.00 280120130.00 250.00 560310.00 3.00 260120204.00 324.00 780456.00 4.00 240 120 292.00 412.00 960 548.00 5.00 220 120 400.00 520.00 1100 580.00 6.00 200 120 534.00 654.00 1200 546.00 7.00 180 120 700.00 820.00 1260 440.00 8.00 160 120 904.00 1024.00 1280 256.00 9.00 140 120 1152.00 1272.00 1260 -12.00 10.00 120 120 1450.00 1570.00 1200 -370.00 11.00 100 120 1804.00 1924.00 1100 -824.00 12.00 80 120 2220.00 2340.00 960 -1380.00 14.00 40 120 3262.00 3382.00 560 -2822.00 16.00 0 120 4624.00 4744.00 0 -4744.00
Maximizing profit Choose the level of output where the difference between TR and TC is the greatest
YPriceFCVCCTRProfit 0.00 3201200.00 120.00 0-120.00 1.00 30012064.00 184.00 300116.00 2.00 280120130.00 250.00 560310.00 3.00 260120204.00 324.00 780456.00 4.00 240 120 292.00412.00 960 548.00 5.00 220 120 400.00 520.00 1100 580.00 6.00 200 120 534.00 654.00 1200546.00 7.00 180 120 700.00 820.00 1260 440.00 8.00 160 120 904.00 1024.00 1280 256.00 9.00 140 120 1152.00 1272.00 1260 -12.00 10.00 120 120 1450.00 1570.00 1200 -370.00 11.00 100 120 1804.00 1924.00 1100 -824.00 12.00 80 120 2220.00 2340.00 960 -1380.00
YPriceFCVCCTRProfit 0.00 3201200.00 120.00 0-120.00 1.00 30012064.00 184.00 300116.00 2.00 280120130.00 250.00 560310.00 3.00 260120204.00 324.00 780456.00 4.00 240 120 292.00412.00 960 548.00 5.00 220 120 400.00 520.00 1100 580.00 6.00 200 120 534.00 654.00 1200 546.00 7.00 180 120 700.00 820.00 1260 440.00 8.00 160 120 904.00 1024.00 1280 256.00 9.00 140 120 1152.00 1272.00 1260 -12.00 10.00 120 120 1450.00 1570.00 1200 -370.00 11.00 100 120 1804.00 1924.00 1100 -824.00 12.00 80 120 2220.00 2340.00 960 -1380.00 14.00 40 120 3262.00 3382.00 560 -2822.00 16.00 0 120 4624.00 4744.00 0 -4744.00
Marginal cost (MC) Marginal cost is the increment, or addition, to cost that results from producing one more unit of output
y Price FC VC C AFC AVC ATC MC TR MR Profit 0.00 320 120 0.00 120.00 0 -120.00 64.00 300.00 1.00 300 120 64.00 184.00 120.00 64.00 184.00 300 116.00 66.00 260.00 2.00 280 120 130.00 250.00 60.00 65.00 125.00 560 310.00 74.00 220.00 3.00 260 120 204.00 324.00 40.00 68.00 108.00 780 456.00 88.00 180.00 4.00 240 120 292.00 412.00 30.00 73.00 103.00 960 548.00 108.00 140.00 5.00 220 120 400.00 520.00 24.00 80.00 104.00 1100 580.00 134.00 100.00 6.00 200 120 534.00 654.00 20.00 89.00 109.00 1200 546.00 166.00 60.00 7.00 180 120 700.00 820.00 17.14 100.00 117.14 1260 440.00 204.00 20.00 8.00 160 120 904.00 1024.00 15.00 113.00 128.00 1280 256.00 248.00 -20.00 9.00 140 120 1152.00 1272.00 13.33 128.00 141.33 1260 -12.00 298.00 -60.00 10.00 120 120 1450.00 1570.00 12.00 145.00 157.00 1200 -370.00
y Price FC VC C AFC AVC ATC MC 3 260 120 204.00 324.0 40.00 68.00 108.00 88.00 4 240 120 292.00 412.0 30.00 73.00 103.00 108.00 5 220 120 400.00 520.0 24.00 80.00 104.00
Marginal Revenue (MR) Marginal revenue is the increment, or addition, to revenue that results from producing one more unit of output Marginal revenue is the change in total revenue from producing one more unit of output
y Price FC VC C AFC AVC ATC MC TR MR Profit 0 320 120 0.00 120.0 0 -120.0 64.00 300.0 1 300 120 64.00 184.0 120.00 64.00 184.00 300 116.0 66.00 260.0 2 280 120 130.00 250.0 60.00 65.00 125.00 560 310.0 74.00 220.0 3260 120 204.0 324.0 40.0 68.0 108.0780456.088.00180.0 4 240 120 292.0 412.0 30.0 73.0 103.0 960548.0 108.00 140.0 5 220 120 400.00 520.0 24.00 80.00 104.00 1100 580.0 134.00 100.0 6 200 120 534.00 654.0 20.00 89.00 109.00 1200 546.0 166.00 60.0 7 180 120 700.00 820.0 17.14 100.00 117.14 1260 440.0 204.00 20.0 8 160 120 904.00 1024.0 15.00 113.00 128.00 1280 256.0
y Price TR MR Profit 3.00 260 780 456.0 180.0 4.00 240 960 548.0 140.0 5.00 220 1100 580.0 100.0 6.00 200 1200 546.0
Another example Increase output from 4 to 5 units y Price TR MR Profit 3.00 260 780 456.0 180.0 4.00 240 960 548.0 140.0 5.00 220 1100 580.0 100.0 6.00 200 1200 546.0
A note on marginal revenue and price Marginal revenue is always less than price WHY? The firm must lower price in order to sell more units
p Revenue Marginal Revenue p0 q q0 1 2 3 4 5 Marginal Revenue = p0
p0 Demand p1 A q0 q1 p MR = A - B B q The lower price applies to all units and so the revenue per unit will be less than the price
Profit Max Using MR and MC An increase in output will always increase profit if MR > MC An increase in output will always decrease profit if MR < MC
The rule is then Increase output whenever MR > MC Decrease output if MR < MC
Example y Price C MC TR MR Profit 3.00 260 324.00 780 456.00 88.00180.00 4.00 240 412.00 960 548.00 108.00 140.00 5.00 220 520.00 1100 580.00 134.00 100.00 6.00 200 654.00 1200 546.00 Yes Should we increase output from 3 to 4? Yes Should we increase output from 4 to 5? No ! Should we increase output from 5 to 6?
TR C Profit Maximization Using Graphs Profit is positive if TR > TC 2000 $ 1800 1600 1400 1200 1000 800 600 400 200 0 0 2 4 6 8 10 12 14 16 18 Output
MC Demand MR Profit Maximization Using MR and MC Profit on a given unit is positive if MR > MC 400 $ 350 300 250 200 150 100 50 0 0 2 4 6 8 10 12 14 16 18 Output
MC Demand MR Two intersections of MC and MR 300 $ 250 200 150 100 50 0 0 2 4 6 8 10 12 14 16 18 20 Output
MC Demand MR The optimal output level occurs where MC intersects MR from below 300 $ 250 200 150 100 50 0 0 2 4 6 8 10 12 14 16 18 20 Output
Why average costs are irrelevant in the short-run The short-run decision is whether to produce one more unit or not Only marginal cost and marginal revenue are relevant for this decision
Marginal Decision Making and Short-run Decisions The marginal approach to profit states that a firm should take any action that adds more to its revenue than to its cost
Examples where marginal decision making is relevant advertising cost efficiency consultant adding a salesperson sprucing up sales area adding a two-year warranty to product
The shutdown rule Do we keep producing if we are losing money? It depends on what we mean by a loss It depends on whether we are in the short-run or in the long run It depends on which costs are fixed, which are variable, and which are sunk
Case 1 - TC > TR at all Q TR > TVC where MR = MC
Total Cost & Revenue Curves TR C VC MC MR 200 TC > TR at all Q 175 Cost 150 125 100 75 50 25 0 0 1 2 3 4 5 6 7 8 9 10 Output - y Marginal Cost & Revenue Curves 40 35 TR > TVC where MR = MC Cost 30 25 20 15 10 5 0 0 1 2 3 4 5 6 7 8 9 10 Output - y
In the short-run fixed costs must be paid independent of the level of output At 6 units of output, total revenue more than covers total variable costs, leaving a residual to help cover fixed costs So the firm should produce 6 units in the short run
The shutdown rule In the short-run, the firm should continue to produce if total revenue exceeds total variable costs; otherwise, it should shut down
Case 2 - TC > TR at all Q TR < TVC where MR = MC