Download
1 / 19
190 likes | 208 Views
Heat Waves in Mediterranean climate regimes: focus on California. Alexander Gershunov Climate, Atmospheric Science and Physical Oceanography (CASPO) Scripps Institution of Oceanography La Jolla, California. Gershunov, Cayan and Iacobellis, Journal of Climate , 2009.

E N D
Heat Wavesin Mediterranean climate regimes:focus on California Alexander Gershunov Climate, Atmospheric Science and Physical Oceanography (CASPO) Scripps Institution of Oceanography La Jolla, California Gershunov, Cayan and Iacobellis, Journal of Climate, 2009
Regional Heat Waves are Changing End of July 2006 INDIVIDUAL HEAT WAVES The heat wave of July 2006 was an unprecedented deadly event. 147 total deaths 99% of cases lived in zip codes where > 50% of residents live below Poverty Guide Line TOTAL HEAT WAVE ACTIVITY Day > Night magnitude Night > Day magnitude California heat wave activity is increasing. Specifically, nighttime-accentuated heat waves are on the rise… Is this a feature of Mediterranean climates in general?
Quantifying Regional Heat Waves • Heat Wave Index,related to impacts: • MAGNITUDE = intensity + duration + spatial extent • Day and nighttime heat waves • Defined regionally from daily weather station data: local temperatures exceeding a threshold
Working definition of extreme heat: Daytime Intensity 2006 Tmax threshold (42.2C/108F) Degrees C Mean Tmax Sacramento Tmax 99th percentile thresholds • Locally extreme temperature exceeding a high percentile threshold t* (e.g. 99%-ile) 99th percentile in C of JJA Tmax over the base period 1950 – 1999. Temperatures have a climatological 0.01 probability of exceeding these thresholds and should be considered locally extreme. Gershunov, Cayan and Iacobellis, Journal of Climate, 2009
Working definition of extreme heat: Nighttime Intensity Sacramento Tmin 99th percentile thresholds • Locally extreme temperature exceeding a high percentile threshold t* (e.g. 99%-ile) 29C/84F 2006 Tmin threshold (22.8C/73F) Degrees C 99th percentile in C of JJA Tmin over the base period 1950 – 1999. Temperatures have a climatological 0.01 probability of exceeding these thresholds and should be considered locally extreme. Mean Tmin Gershunov, Cayan and Iacobellis, Journal of Climate, 2009
An Index of California Regional Heat Wave Activity Daytime Heat Wave Activity Nighttime Heat Wave Activity Daytime heat wave activity has increased somewhat 2006 2003 Nighttime heat wave activity is ramping up for all local durations Gershunov, Cayan and Iacobellis, Journal of Climate, 2009
Seasonal Maxima of Regional Heat Wave Components Tmax Tmin Gershunov, Cayan and Iacobellis, Journal of Climate, 2009
GREAT HEAT WAVES AND THEIR OVERALL REGIOINAL MAGNITUDES Local intensity + duration + spatial extent in degree days summed over the region for the six greatest daytime and six greatest nighttime events 2006 2003 degree days per station 1972 1960 2002 1981 1961 jun 1990 2001 1983 1961 aug 1992 Gershunov, Cayan and Iacobellis, Journal of Climate, 2009
What is the meteorological difference between daytime and nighttime heat waves? Contours and colors represent the same anomalies, but only values statistically significant with 95% confidence (two-tailed test) determined via bootstrap re-sampling (performed with 1000 re-sampled 5-date composite anomaly maps) are plotted in color. Low level wind vectors are colored blue where significant according to similar re-sampling test performed for the u- and v-components separately. Significance is everywhere a function of magnitude and location. The reference period for computing anomalies is 1950 – 1999, as elsewhere. The anomalies are computed from 24-hour averaged fields. Surface circulation (wind at sigma level 995, arrows in m/s) and mean sea level pressure in millibars (a,b), 500mb geopotential height in meters (c,d), and precipitable water kg/m2 (e,f) anomalies with respect to JJA mean. Anomalies are composited for the peak days of the largest five daytime events (a,c,e) and the largest five nighttime events (b,d,f). The data are from the NCEP/NCAR Reanalysis I. Red rectangles outline regions used for evolution plots presented below. Great nighttime events Great daytime events Moisture is what makes the difference between day and nighttime heat waves in this arid region
WHY THIS CHANGE IN HEAT WAVE ACTIVITY? • IS IT NATURAL? • IS IT ANTHROPOGENIC? • IS IT REGIONAL? • IS IT GLOBAL? • IS IT ALL OF THE ABOVE? Day > Night magnitude Night > Day magnitude
Is there a trend in humidity?Where does the moisture come from? a) Linear trend in Precipitable Water (Reanalysis 1) b) PWTR Trend off Baja California Linear trend computed at each pixel of the PRWTR averaged for July. Significant trends (95% significance level in a two-tailed test) are colored. (b) July PRWTR in the box [132.5-125W, 25-35N] and linear trend significant well above the 99% level for both the full and base (not shown) periods. Gershunov, Cayan and Iacobellis, Journal of Climate, 2009
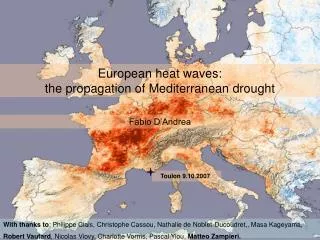
Why this moisture trend?Regional SST warming Linear trend in sea surface temperature (C/decade) SST Trend off Baja California As this region becomes warmer and more moist, the atmospheric circulation associated with heat waves, tends to bring humid air into California, giving heat waves a stronger nighttime expression.
GLOBAL TEMPERATURE Variations of the Earth’s surface temperature Departures in temperature in oC (from the 1990 value) • As temperature around the globe continues to rise, we can expect changes in specific regional weather extremes: • Heat waves • Cold spells • What changes do models show in summertime heat waves in California? 8 6 Projections 4 2 0 oF Proxy Instrument oC
California Heat Waves and Global Climate Change: CNRM ONE CLIMATE MODEL UNDER THE MILD EMISSIONS “B1” SCENARIO PAST PRESENT FUTURE observations Day > Night magnitude Night > Day magnitude
California Heat Waves and Global Climate Change: CNRM ONE CLIMATE MODEL UNDER THE MILD EMISSIONS “B1” SCENARIO SUGGESTS THAT THE OBSERVED CHANGE IS A TIP OF THE ICEBERG PAST PRESENT FUTURE observations Day > Night magnitude Night > Day magnitude
California Heat Waves and Global Climate Change WHAT DO OTHER MODELS SHOW?
California Heat Waves and Global Climate Change: GFDL ANOTHER CLIMATE MODEL UNDER THE MILD EMISSIONS “B1” SCENARIO SUGGESTS INCREASE, BUT IN THE OPPOSITE SENSE PAST PRESENT FUTURE observations Day > Night magnitude Night > Day magnitude
What’s happening in other Mediterranean Climate Regimes? SPAIN Tmax Tmin At least one, two and three day/night local duration events Courtesy of Maria Jose Ortiz Bevia
Conclusions • In California: • Great heat waves are primarily day or nighttime events caused by specific pressure, wind and moisture patterns • Tendency towards more humid heat waves and unprecedented nighttime temperatures have implications for energy demand, agriculture, public and animal health… • Climate models suggest trends will continue and accelerate – BUT NOT ALWAYS IN THE OBSERVED SENSE • Is the observed trend over California and Nevada reflected over other world regions with similar “Mediterranean” climates? • Spanish heat waves are increasing somewhat consistently with their Californian sisters, but without a disproportionate nighttime intensification • Climate change is playing out with regional idiosyncrasies