Download
1 / 9
100 likes | 383 Views
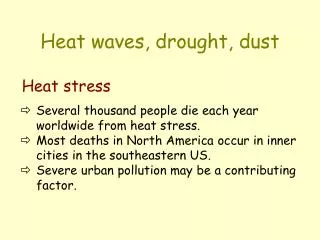
Gregorio Gomez Robert Sauermann Ben Lynton. Heat waves. 55,000 deaths Annual crop production dropped by 25% 15 billion USD loss to the Russian economy Could it have been predicted?. 2010 Moscow Heat wave. Understanding changes in mean and variance.

E N D
Gregorio Gomez Robert Sauermann Ben Lynton Heat waves
55,000 deaths Annual crop production dropped by 25% 15 billion USD loss to the Russian economy Could it have been predicted? 2010 Moscow Heat wave
Understanding changes in mean and variance • Increases in mean increase incidence of heat waves • Increases in variance increase incidences of hot and cold spells
Dole et al. (2011) • Motivation: Was the magnitude of the 2010 Russian heat wave a result of anthropogenic influence, slowly evolving ocean boundary conditions, or natural variability? • Concludes the Russian heat wave was primarily a result of internal atmospheric variability • Suggests that the frequency of heat waves is expected to increase in the near future
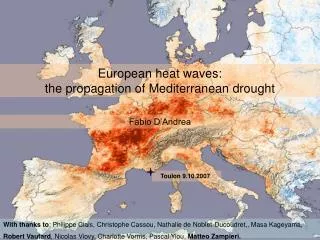
The Russian 2010 heat wave • High pressure zone traps hot air • Wind patterns trap particulates and reduce cloudiness • Severe drought amplifies heat wave intensity due to land-surface feedbacks • 2010 event was classic “omega” blocking pattern
Paper 2: Rahmstorf & Coumou (2011) • Motivation: has global warming affected the frequency of extreme temperature events? • In proportion to the global warming trend, the frequency of record heat wave events has increased. • Statistical models show an approximate 80% probability that the 2010 Russian heat wave would not have occurred without global warming.
Temperature Models • Panels A, B, and C represent simulated temperature data sets with extremes marked • Panels D and E show actual temperature increases for global and Moscow temperatures
Paper 3: Otto et al. (2012) • Motivation: reconciling Dole et al.(2011) & Rahmstorf and Coumou (2011) • “the difference in conclusion between these two papers illustrates the importance of specifying precisely what question is being asked” • Paper 1 finds natural causes for magnitude of heat wave • Paper 2 relates global warming to frequency of heat waves • From empirical data and model simulations, global warming may be accountable for heat wave frequency
Epic March — The Washington Post (2012) • Record Highs in Midwest, Great Lakes, Northeast • Link to Global Warming? • U of Utah, TWC representatives attribute global warming • Accuweather representatives ask for more data • Heat Dome • Low Pressure • Public opinion is varied, yet potentially influential