Download
1 / 21
210 likes | 347 Views
Scale Evolution of Coastal Upwelling Frontal Instabilities. Scott Durski. R. M. Samelson, J. S. Allen, G.D. Egbert. Oregon State University College of Oceanic and Atmospheric Sciences. Previous work. Surface density. Durski and Allen (JPO, September 2005).

E N D
Scale Evolution of Coastal Upwelling Frontal Instabilities Scott Durski R. M. Samelson, J. S. Allen, G.D. Egbert Oregon State University College of Oceanic and Atmospheric Sciences
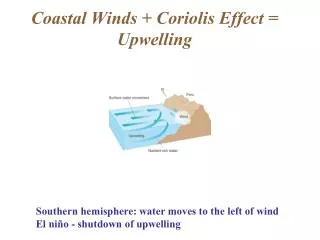
Previous work Surface density. Durski and Allen (JPO, September 2005) • periodic domain with alongshore uniform bathymetry representative of the Oregon shelf • typical summer stratification • steady upwelling favorable wind forcing • Disturtbances initially develop fastest at approximately an 8-10 km scale. • The predominant alongshore scale of the disturbances rapidly progresses to longer wavelengths.
Instabilities on a time evolving flow. Offshore advection of the upwelling front Alteration of the alongshore average flow by finite amplitude evolution of the instabilities Wave-wave interactions What might lead to changes in the predominant disturbance scale?
0 200 400 600 800 1000 100 50 0 150 Experimental Setup Model Settings: No explicit horizontal mixing. Mellor-Yamada level 2.5 vertical mixing. 3rd order upstream advection scheme. Domain: Periodic channel domain Uniform alongshore resolution – 1 km. Stretched grid in the across shore – 400m at the coast to 4000m 150 km offshore. 30 vertical sigma levels, concentrated near the surface and bottom. Alongshore uniform domain 240 km y (km)
Experimental Concept 0 -20 -40 z (m) -60 1. A Frozen field. 4. The alongshore average of a 3-dimensionally evolving upwelling front. 0 -20 -10 tb ts x (km) 3. A 3-dimensionally evolving upwelling front. 2. A 2-dimensionally evolving upwelling front. 5. The nonlinear evolution of an additionally perturbed simulation. Starting point: A 5 day integration of the nonlinear model from a state of rest, with a sustained upwelling favorable wind stress and no perturbations in the alongshore direction. The nonlinear model can be expressed as: and the tangent linear model as Consider linear disturbance growth about a set of background states
Disturbance structures on the frozen field Long time integration of the tangent linear model on the frozen day 0 alongshore uniform background state yields estimates of the disturbance growth rate as a function of wavenumber. • linear disturbances grow fastest at approximately an 11 km scale. • Disturbance structure is shallow and largely confined to the frontal region. Initial disturbance structures for the experiments are composed of ‘modal structures’ at wavelengths between 4 km and 240 km. Initial disturbance energy is normalized so as to be uniform across the spectrum. Multiple perturbations are generated with random phase shifts of different spectral components. Estimate of disturbance growth rate and disturbance amplitude structure at two wavenumbers for the TLF experiment.
0 0 0 0 0 y (km) y (km) y (km) y (km) y (km) -10 -10 -10 -10 -10 -20 -20 -20 -20 -20 NLM – relaxed winds The nonlinear model exhibits an evolution to larger scale under relaxed winds that is similar to that under sustained winds. Surface density and deviation from the alongshore average for the base case nonlinear relaxed wind experiment.
Disturbance amplitude structure at the fastest growing alongchannel wavenumber over the first 1.5 days. Two-dimensionally evolving background state under relaxed winds. Surface perturbation density in the TL2D and NL models. TL2D disturbance evolution Disturbance evolution on an alongshore uniform upwelling front during relaxation. Perturbation density evolution is comparable to that in the nonlinear model only over the first several days.
Comparison of So2D and So<3D>background states under relaxed winds. Surface perturbation density in the TL2D, TL<3D> and NL models. TL<3D> disturbance evolution Disturbance evolution on the alongshore average of a three-dimensionally evolving upwelling front during relaxation.
TL3D disturbance evolution Disturbance evolution on the full three-dimensionally evolving upwelling front. Surface perturbation density in a TL3D simulation. The standard deviation among perturbations in an ensemble of 15 TL3D, and NLp simulations and the nonlinear model surface density evolution.
0 2 4 6 8 10 t (days) Quantifying the rate of scale change Define an energy as a function of wavenumber. and the volume integral … Calculate an energy-weighted mean disturbance wavenumber. Mean alongchannel wavenumber kmean, as a function of time for the relaxed wind experiment.
Perturbation energy Ep(k), as a function of time for the relaxed wind experiment. The time-rate of change of Ep(k) as a function of wavenumber for the relaxed wind experiment (normalized by the maximum rate of change at each time). Disturbance energy and it’s rate of change
0 0 0 0 0 y (km) y (km) y (km) y (km) y (km) -25 -25 -25 -25 -25 -50 -50 -50 -50 -50 NLM – sustained winds Surface density and deviation from the alongshore average for the base case nonlinear sustained wind experiment.
Two-dimensionally evolving background state under relaxed winds. Disturbance amplitude structure at the fastest growing alongchannel wavenumber over the first 1.5 days. Surface perturbation density in the TL2D and NL models. TL-2D disturbance evolution
Comparison of So2D and So<3D>background states under relaxed winds. Surface density and deviation from the alongshore average for the base case nonlinear sustained wind experiment. TL<3D> disturbance evolution
Rate of change of Ep(k) as a function of wavenumber for the relaxed wind experiment (normalized by the maximum rate of change at each time). Mean alongchannel wavenumber kmean and Ep(k) as a function of time for the relaxed wind experiment. Quantifying the rate of scale change
Forcing for the sustained and relaxed wind experiments. kmean and Ep(k) as a function of time for experiments with relaxed, partially sustained and fully sustained upwelling favorable wind stress. Variable wind forcing
Comparison of vertical structure of disturbances SW RLX TL NL TL NL SW TL(Kv=0.01Kvo TL Modal structure at fastest growing alongchannel scale for the sustained and relaxed wind cases. Bottom pair of panels shows the structure in a modified sustained wind TL3D simulation with reduced vertical mixing coefficients.
Conclusions • Although the frontal disturbances in the nonlinear model exhibit a progression to larger scale over the full range of forcing scenarios considered, the mechanisms most responsible for the processes differ between wind forced and unforced cases • Under relaxed wind conditions the tangent linear disturbance growth experiments indicate that the scale evolution over the first four days is reflected in the way linear disturbances respond to the adjustment of an alongshore uniform upwelling front to wind relaxation. • Under relaxed winds, the continued increase in scale between days 4 and 7, relates to the linear disturbance evolution on an alongshore average flow that has been altered by wave-mean flow interaction. • The disturbance alongshore scale change past day 7 in the relaxed wind experiment and throughout the sustained wind experiment is not captured by the scale of the disturbances in the linear growth experiment and evidently results largely from wave-wave interaction processes.