Download
1 / 53
600 likes | 949 Views
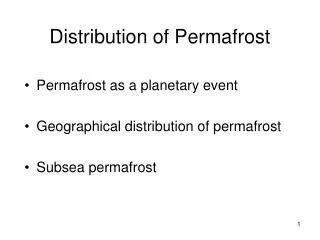
Permafrost. Andrew G. Slater. Permafrost in the News. What is Permafrost?. Near-Surface Permafrost. IPA Permafrost Distribution Map . Continuous Discontinuous. Continuous (90 – 100% coverage) Discontinuous (50 – 90%) Sporadic (10 – 50%) Isolated (0 – 10%). Brown et al., 1998.

E N D
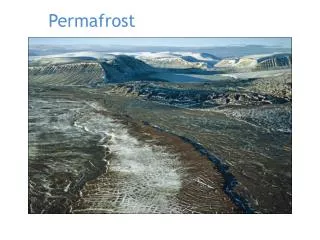
Permafrost Andrew G. Slater
What is Permafrost? Near-Surface Permafrost IPA Permafrost Distribution Map Continuous Discontinuous Continuous (90 – 100% coverage) Discontinuous (50 – 90%) Sporadic (10 – 50%) Isolated (0 – 10%) Brown et al., 1998
Deep Soil Temperatures (Alaska) Temperature at 20m Depth Photo: A. Slater Hinzman et al., 2005
Deep Soil Temperatures (Alaska) CHANDALER SHELF Data/Images Courtesy V. Romanovsky, UAF
Deep Soil Temperatures (Russia) 10m temperatures 15m temperatures 10m temperatures Oberman, 2008; Romanovsky et al., 2008
Active Layer Thickness Image:Slater, Data: Circum-Polar Active Layer Monitoring (CALM) Network
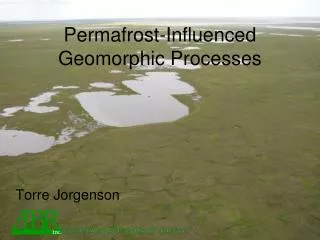
Why does Permafrost matter? • Impacts on the landscape • Impacts to hydrology • Infrastructure • Vegetation changes • Carbon cycle
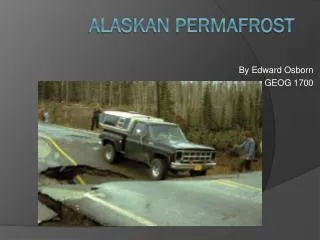
Landscape Changes & Ice-Rich Permafrost Caribou-Poker Creek, AK, July 1999
Siberian Lake Appearance and Disappearance Smith et al., 2005
Vegetation Changes – Shrubs & Treeline • Changes: • Albedo • Insulation • Snow trapping • Transpiration 1950 2002 Sturm et al., 2005
Permafrost Organic Carbon Content New estimates of carbon in frozen soils (NH) Tarnocai et al., 2009
Sea Ice – Permafrost Interactions Lawrence, Slater, Tomas, Holland and Deser, 2008
LSM LSM Land Surface Models – what are they? • Traditionally, an atmospheric boundary condition • Energy, Mass and Momentum transfer • Albedo, Radiant Temperature • Sensible and Latent (Evap.) Heat fluxes • Coupled moisture and energy ATM ATM ATM LSM
Fluxes are main aim Feedbacks important Coupled Hydrology Global/Continent scale Less than 10 layers 5-30min time step Meteorology forcing Temp / Thaw is main aim No feedbacks Hydrology optional (?) Point & Local scale Up to +100 layers Daily time step (?) Temperature & snow forcing Model Purpose and Philosophy Land Surface Model Permafrost Model
Where have we been? (где мы были?) • 1970’s : Example: Simple ‘bucket’ case • No temperature adjustment for soil freezing • No infiltration in presence of snow Ks KL* L H evaporation precipitation q: surface moisture content a G
Where have we been? (где мы были?) • 1980’s : First generation LSM’s • Little accounting for soil fusion term • Infiltration a function of soil temperature • Simple snow models included q1 T1 q2 T2 q3 T3
Where have we been? (где мы были?) • 1990’s : More Physics • Inclusion of explicit soil ice more common • Soil columns still shallow (<5m) • “Tiled” vegetation representation • Bulk and multi-layer snow models • Impacts of frozen ground receives recognition • NWP (Viterbo et al., 1998) • GCM’s (Slater et al, 1998)
Where are we now? (где мы сейчас?) • 2000’s and beyond: Earth System Models • Most models include explicit soil ice • Carbon cycle modeling • Dynamic Vegetation • Better snow models (?) • Still a wide variety of complexity in models.
Momentum flux Wind speed 0 ua Surface energy fluxes Biogeochemical cycles Hydrology BVOCs Photosynthesis Precipitation Diffuse solar Fire Downwelling longwave Direct solar Autotrophic respiration Transpiration Sensible heat flux Evaporation Latent heat flux Reflected solar Emitted longwave Phenology Vegetation C/N Throughfall Absorbed solar Dust Evaporation Sublimation Aerosol deposition N dep N fixation Surface runoff Heterotrophic respiration Infiltration Melt Litterfall SCF Soil heat flux Saturated fraction Soil C/N Root litter Soil Soil (sand, clay, organic) Denitrification N leaching Aquifer recharge N uptake N mineralization Water table Sub-surface runoff Unconfined aquifer Bedrock Glacier Runoff Disturbance Lake Competition Wetland River Routing Vegetation Dynamics Land Use Change River discharge Wood harvest Urban Growth
Indirect Measure • Surface Frost Index • Nelson & Outcalt (1987) • Climate Only • Steady-State • Empirical Estimate
Range of Near-Surface Permafrost Area (1900-2100) Slater & Lawrence, 2013
Mean Soil Temperature @ 3.3m (RCP 8.5) Slater & Lawrence, 2013
Direct vsIndirectDiagnosis • Impact of Land Model • Common result across RCPs Slater & Lawrence, 2013
Climate Change in the Permafrost Region Slater & Lawrence, 2013
One Estimate of Change in Permafrost Area Slater & Lawrence, 2013
Where are we now? (где мы сейчас?) SNOW MODELS • Can’t model permafrost without modeling snow • Many different model structures • Has a big impact on model ability Slater et al., 2001
Where are we now? (где мы сейчас?) Koven et al., 2013
Where are we now? • Different: • Number of soil layers • Depths per layer • Hydrologiaclly active layers • Which is sufficient? • Which is best? CMIP5 Models Slater & Lawrence, 2013
Where are we going? (куда мы идем?) • Organic Soils • Improved Hydrology • Excess Soil Ice • Thermokarst • Numerical Methods • Vegetation Interactions • Sub-grid permafrost • Heterogeneity
Organic Soil and Deep Soils Lawrence & Slater, 2008; Lawrence et al., 2008
Improved Hydrology Transient Layer NEW OLD Swenson & Lawrence, 2012
Improved Hydrology OLD NEW Swenson & Lawrence, 2013
Excess Soil Ice & Projected Subsidence Lee, Swenson, Lawrence & Slater, 2013
Ice Wedge: Permafrost Tunnel, Fairbanks, AK Photos: A. Hurley; A.Slater
Spatial Heterogeneity July, 1999 – Council, AK
σ2 Parameterizing Thermokarst Microtopography PDF σ1 High relief: e.g. after thermokarst Height above mean surface (m)
Data • Still many gaps • Getting much better ? ? ? Romanovsky et al., 2010
Thanks. Any questions? Спасибо. Есть вопросы? Photo: Tom Douglas