Download
1 / 25
250 likes | 337 Views
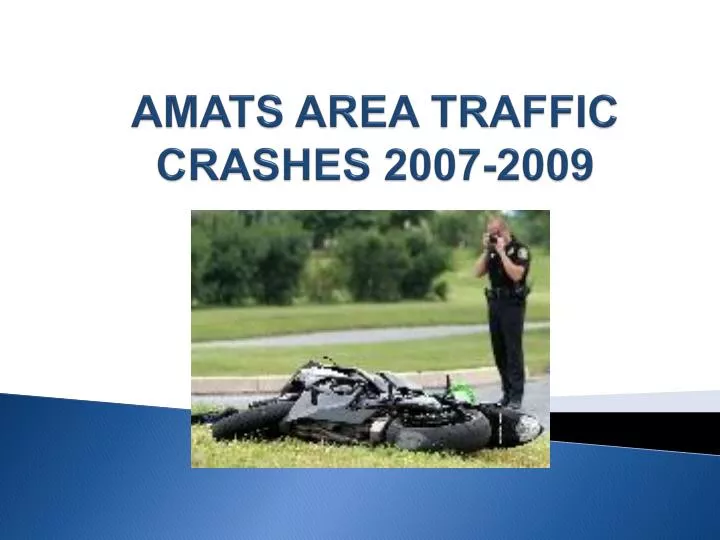
AMATS AREA TRAFFIC CRASHES 2007-2009. Crash Trends. Overall crashes continue to decline. 54,518. Crash Trends. Injuries continue to decline. 13,665. Crash Trends. Fatalities continue to decline. 147. Community Trends. Community Trends (Continued). ODOT Traditional Safety Program.

E N D
Crash Trends • Overall crashes continue to decline 54,518
Crash Trends • Injuries continue to decline 13,665
Crash Trends • Fatalities continue to decline 147
ODOT Traditional Safety Program ODOT spends about $72 million annually on projects and programs that address high and severe crash locations on any public road. • Applications due in central office on April 30 and September 30, due in district office approximately six weeks earlier • Funding available for PE, RW, construction • Typical requests range from $50,000 to $5 million
Eligibility Anyone can have a crash location reviewed or apply for funding through ODOT district offices Minimum criteria: • Any public roadway • At least 10 crashes and a rate of 1.0 / MVMT over 3 years (all the locations in Table 1 and 2 meet this criteria) • Local projects with lower threshold evaluated on case-by-case basis • Local match is required (usually 10%) unless signs, signals or pavement markings • Contact David Griffith from District 4 for more information
High Risk Rural Roads • Federal set aside program that provides $2.3M annually • Fatalities are 2.75 times higher on rural roads than on other roads. • Only eligible for: • Rural major/minor collectors and rural local roads (FC 7,8,9) • Serious injury or fatality crash rate above statewide average • Fix must address safety problem • Right-size your request to match the funding available • Projects should be in the $100,000 to $1M range
What Sells … A committee looks at traditional criteria like crash rate, severity, countermeasures etc. But projects also score higher based on: • Relative ranking (statewide, regional or local) • Clear match between fix and crash pattern • Previous efforts to address crashes at lower cost • Rate of Return • Ability to fund local share • Incorporates state safety goals
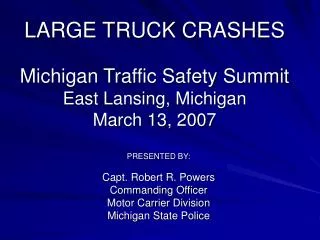
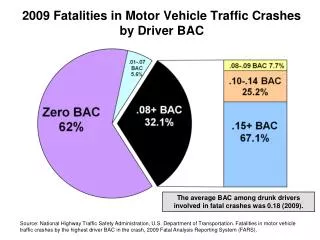
Emerging Highway Safety Trends to Watch(Nationwide and AMATS Area) • Motorcycle deaths:13% of total and double-digit annual growth • 13% of total in AMATS Area, slight decrease between 2007 and 2009 • Large truck related fatalities: 13% of total • 7% of total in AMATS Area. Still a concern but in urbanized areas a higher number of cars dilutes the truck accident percentage • Aging driving population • Downsizing of passenger cars; increasing size and number of trucks
Change From Previous Crash Reports • Distance from an intersection for crash to be considered “intersection related” • Previous distance was 0.10 mile (528 feet) • New distance is 0.05 mile (264 feet) • This was done in order to better define crashes in urban areas and to be consistent with the new Highway Safety Manual that is now available from the American Association of State Highway and Transportation Officials (AASHTO)
Locations Are Ranked by Their Composite Score • The composite score is an overall score derived from where a location is ranked according to: • Total number of crashes • Crash rate • Severity Index • The composite score not only considers number of crashes at a location but also the traffic volume and injuries
Highway Sections • 134 highway sections meet the minimum criteria of ten crashes per mile per year and a minimum crash rate of 1.0 crash per million vehicles miles traveled • Table 1 and Map 1 in the crash memorandum
Intersections • 281 intersections meet the minimum criteria of ten crashes in the three year period and a crash rate of 1.0 crash per million approach vehicles • Table 2 and Map 2 in the crash memorandum
Freeways • Freeway safety analysis done by the Ohio Department of Transportation • Entire statewide freeway system is analyzed • High crash locations can be freeway sections or interchanges • 58 locations meet the minimum criteria • Table 3and Map 3 in the crash memorandum
Conclusions • Total crashes, injuries, and fatalities are continuing to decrease. • Please send all crash reports to the Ohio Department of Public Safety • All the locations in the tables are eligible for ODOT Highway Safety Program (HSP) funding • Funding can be used for design, right of way, and construction • Contact David Griffith from District 4 for more information
Conclusions (Continued) • Although crashes are declining, areas of special concern for safety are motorcycles and multitasking whiledriving. There is multi-agency interest in more research. • Please feel free to contact AMATS with questions about this memorandum or more information about a specific location. • Table 1 and 2 is also available with locations listed by community
No, they make them better, and safer. And we also design and build roads safer. That along with enforcement and education is leading to improved safety statistics.