Download
1 / 16
160 likes | 219 Views
Pedestrian Crashes on Five Orlando-Area Arterials. Scope of Study. All long-form crash reports From years 1993 through 1997 US 17/92 (SR 50 to SR 46) US 441 (SR 50 to US 192) US 192 (Turnpike entrance to Lake Co. line) SR 50 (Lake Co. line to east end of SR 408)

E N D
Scope of Study • All long-form crash reports • From years 1993 through 1997 • US 17/92 (SR 50 to SR 46) • US 441 (SR 50 to US 192) • US 192 (Turnpike entrance to Lake Co. line) • SR 50 (Lake Co. line to east end of SR 408) • SR 436 (US 441 to Beeline Expressway)
Date & Time (8) Crash Type and Location Type (3) Pedestrian Demographics (5) Motorist Demographics (5) Alcohol Use (both) Injury Severity Traffic Control Sidewalk Presence Environmental Conditions (7) Lighting Weather Roadway Conditions Vehicle Type & Defect (2) Posted Speed Estimated Speed Contributing Factors (both) Hit & Run Citations Given Name of Nearest Signalized Intersection and Pedestrian Amenities Distance to Nearest Signal and/or Ped. Signal Number of Lanes Existence of Median Residence (Urban area, Florida, US, Foreign -- both ped and motorist) Fault Misassigned? Factors
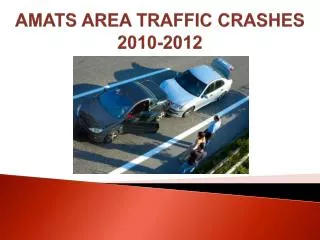
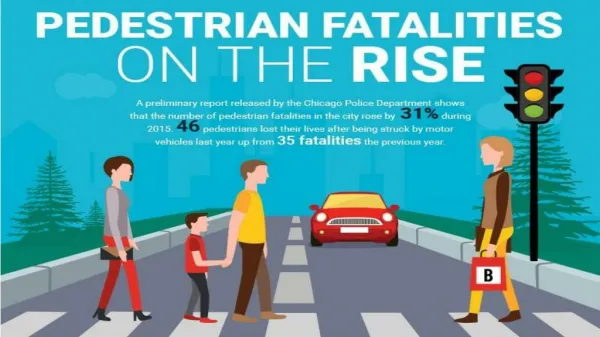
Significance of These Crashes While the five highways in the study only account for about 1.5% of the total centerline miles of streets in Orange, Seminole and Osceola Counties, they experienced 17% of all pedestrian crashes and 36% of all pedestrian deaths.
Round-Trip Walk Time to Nearest Traffic SignalOf 457 mid-block crashes. Based on 4 feet per second walk rate; includes 2 minute delay at signal.
Round-Trip Walk Time to Nearest Pedestrian SignalOf 457 mid-block crashes. Based on 4 feet per second walk rate; includes 2 minute delay at signal.
Motorist Contributing Factors When Pedestrians Were Intoxicated
Signals per Mile Percent Crashes Not at Signal