Download
1 / 26
260 likes | 333 Views
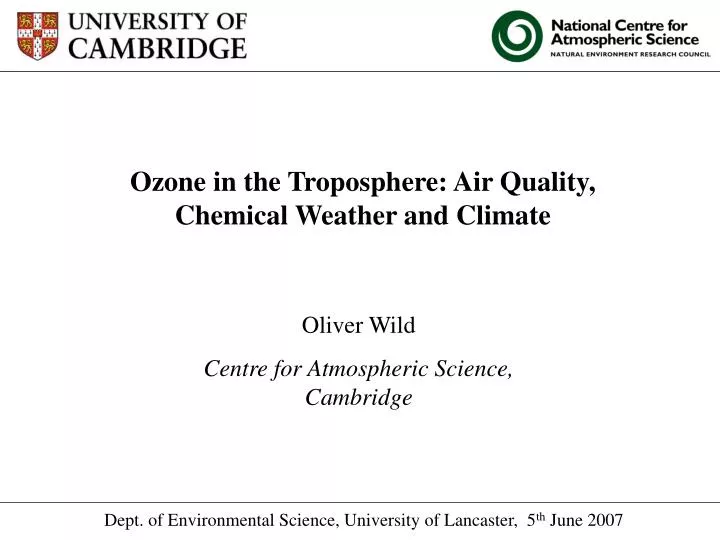
Ozone in the Troposphere: Air Quality, Chemical Weather and Climate. Oliver Wild Centre for Atmospheric Science, Cambridge. Dept. of Environmental Science, University of Lancaster, 5 th June 2007. Why are we Interested in Tropospheric Ozone?.

E N D
Ozone in the Troposphere: Air Quality, Chemical Weather and Climate Oliver Wild Centre for Atmospheric Science, Cambridge Dept. of Environmental Science, University of Lancaster, 5th June 2007
Why are we Interested in Tropospheric Ozone? • Environmental impacts on local, regional and global scales • Secondary pollutant: sensitive to many variables • Chemical production can be fast in polluted conditions • Lifetime is sufficiently long for global-scale transport Pollution: O3 is an important component of photochemical smog Climate: Direct: O3 is a greenhouse gas Indirect: O3 governs lifetime of other GHGs via OH Tropospheric oxidation: O3 regulates oxidation through control of OH and controls removal of CH4, VOCs, etc. Anthropogenic Influence: Surface and Tropospheric O3 is increasing due to human activity
Ozone in the Troposphere • Intercontinental transport of O3 from industrial sources • Very long-range transport and the global O3 background • Regional meteorology and its impacts on O3 • How do physical processes govern chemistry and transport? • Characterising the uncertainty in current chemistry models • Can we explain the observed trends in O3 and CH4? • What processes affecting O3 are least well understood? • Underlying themes: • Development and evaluation of tropospheric chemistry models • Thorough testing of models against atmospheric measurements • Application to air quality and climate issues (O3 and CH4)
Processes Controlling Tropospheric O3 O3 O3 Strat.-Trop. Exchange NMHCs, CH4, CO OH HO2, RO2 CO, O3 hν NO NO2 O3 OH HO2 H2O hν O3 O3 Emissions Deposition
Processes Controlling Tropospheric O3 O3 O3 Strat.-Trop. Exchange STE: Governed by meteorological systems, filamentation and mixing NMHCs, CH4, CO OH HO2, RO2 CO, O3 hν Chemistry: O3 production is non-linear; strongly location-dependent NO NO2 O3 OH HO2 H2O hν O3 O3 Emissions Deposition: dependent on highly variable surface environment Deposition
Wild and Prather [2000] Wild and Akimoto [2001] Wild et al., [2003] FRSGC/UCI Global CTM 2 50 100 Strat-Trop Exchange Strat. Chemistry: Linoz 200 Pressure /hPa Cloud Formation Lightning NOx source 400 Convection: Tiedke Photolysis: Fast-J Advection: 2nd oM Tropospheric Chemistry ASAD, 37 species 600 PBL Turbulence 800 Emissions Deposition Surface Processes 1000 37 Levels T42 resolution (2.8°x2.8°); driven with ECMWF-IFS forecast fields
1. Intercontinental Transport of Ozone Current Industrial/Fossil Fuel NOx Emissions • Industrial emission regions located at similar latitudes • Transport times about 1 week; chemical lifetime 3-4 weeks • How much do major emission regions affect each other? • How much do they contribute to background O3? • Could this affect attainment of air quality standards? • Explore O3 production and transport with 3-D global CTM • Single-region anthropogenic emission perturbation experiments
Photochemistry active in summer • Transport most efficient in spring Largest O3 impacts in late spring Wild and Akimoto [2001]
Source-Receptor Matrix East Asian Emissions • Major emission regions directly affect each other • Upwind sources contribute 1-2 ppbv to surface background O3 • This is sufficient to affect attainment of air quality standards • Study now being repeated with many models (HTAP) to inform policy US Emissions European Emissions
2. Regional Meteorology and Chemical Weather Key Questions and Challenges • How are regional and global impacts influenced by meteorology? • What is the variability in O3 production from a given source? • How does meteorology govern climate impacts of sources? • How will future changes in meteorology affect climate impacts? • How well can models simulate the time scales for O3 formation? Model Approach • Perturb fossil fuel NOx/CO/NMHC emissions over one region for one day • Follow atmospheric perturbation for 1 month • Repeat for each day of March 2001 (TRACE-P measurement campaign) • Look at variability in magnitude and location of O3 production
Ozone Responses Look at regional and global O3 from a single day’s emissions over Shanghai March 12 • Sunny, high pressure • Strong regional P(O3) March 16 • Heavily overcast • Little regional P(O3) Regional production different, Global production similar • Evolution quite different • Location of P(O3) different
Meteorological Setting on March 12 and 16, 2001 Column- and latitude-integrated gross O3 production over the first 3 days following 1 day of emissions over Shanghai H L H L
Ozone Response to Shanghai Emissions Global Ozone Increase Regional Ozone Increase • Effects on O3 burden • Days with high regional O3 (smog) have a reduced effect on global O3 • Regional meteorology strongly influences climate impacts Regional Boundary Layer Distant Boundary Layer Free Troposphere • P(O3) vs. NOx loss for each day • O3 production efficiency (OPE) strongly dependent on location • Good representation of lifting processes is required!
3. Exploring the Uncertainty in Current CTMs O3 Burden vs. O3 Lifetime • CTM studies show large differences in O3 burden and lifetime • Where do these differences originate? • Perform sensitivity study on key processes in a single CTM • Identify processes contributing to this uncertainty Diagonals in grey show O3 loss rate (Tg/year) (τO3 = Burden/Loss) • ACCENT studies • CTM with NMHC • CTM without NMHC
3. Exploring the Uncertainty in Current CTMs O3 Burden vs. O3 Lifetime • CTM studies show large differences in O3 burden and lifetime • Where do these differences originate? • Perform sensitivity study on key processes in a single CTM • Identify processes contributing to this uncertainty Diagonals in grey show O3 loss rate (Tg/year) (τO3 = Burden/Loss) 330 Tg/yr • ACCENT studies • CTM with NMHC • CTM without NMHC Best estimates from recent model studies 22.4 days
3. Exploring the Uncertainty in Current CTMs O3 Burden vs. O3 Lifetime Sensitivity to key variables explains much of the scatter Diagonals in grey show O3 loss rate (Tg/year) 800 Tg STE 60 Tg NOx 7.5 Tg NOx lightning 460 Tg dep 650 Tg Isop −20% H2O −20% T−5°C T+5°C 975 Tg dep 30 Tg NOx +20% +20% H2O 0 Tg 250 Tg STE 0 Tg
3. Exploring the Uncertainty in Current CTMs • Summary of key sensitivities • NOx emissions: more O3, P(O3), more OH • Isoprene emissions: more O3, P(O3), less OH • Lightning NOx: poorly constrained, large impact on O3 and OH • Meteorology: effects of humidity and STE • Implications • Current models are not good enough to model trends in O3 and CH4! • ACCENT studies • CTM with NMHC • CTM without NMHC Account for 2/3 of model variability
Future Studies • Modelling atmosphere-vegetation interactions • Important feedbacks between O3, VOC, N-species and plants • Interaction of anthropogenic and vegetation emissions is very poorly understood and requires spatial disaggregation • Currently lead the ‘biogenic fluxes’ theme in JULES Requires improved treatment of biogenic emissions and deposition. Involves collaboration with land use and vegetation community and a full Earth System approach Climate aerosol NOx, CO VOC O3 VOC NOy NO Soils Crops
Future Studies • Improved treatment of urban emissions in climate models • Improved simulation of O3 production in coarse-resolution models • Reduced bias in regional/global O3 important for climate • Allows better testing against surface observations • Important for assessing environmental impacts of Megacities Background These processes function on a range of scales, but their impacts on climate have not been assessed. Involve strong collaboration with the UK and EU urban & local modelling community Plume Mixing zone Wind Direction
Future Studies • Modelling the evolution of tropospheric oxidation • Reproducing the observed trends in CH4 and O3 • Important for climate and air quality communities • Requires improved understanding of tropospheric chemistry • Need a better characterization of variability in CH4 sources Need more thorough testing of models vs. observations Contributes to goals of new international Atmospheric Chemistry and Climate project
Annual Mean Impacts on O3 Wild and Akimoto [2001]
Daily O3 from Source Regions in Springtime Global Impact Receptor Region
r2=0.92 OPE=35
Evolution of O3 profile over Cheju, Korea in CTM TRACE-P Ozonesondes Tropopause Pressure /hPa • Stratospheric intrusion at Cheju, Korea, March 1–2, 2001 • Intercepted by sondes on successive days • Very different profiles • CTM captures evolution of features well • Two layers on March 1 • Background strat. enhancement • One high layer on March 2 • Residual strat air mixed in • Suggests mechanisms for STE can be captured, but demonstrates high degree of variability in ozone March 1, 2001 March 2, 2001 Sonde data: Sam Oltmans, NOAA/CMDL
Net O3 Production Rate • Instantaneous O3 production in CTM vs. box model constrained by observations • Mean latitude-altitude profile over all DC8/P3B flights • Net destruction in tropical marine boundary layer • Strong production over Japan • Strong plume activity in outflow region, 23º–32ºN • Net production in upper trop (underestimated in CTM) (Box model: Jim Crawford, NASA Langley, Doug Davis, Georgia Tech.)