Download
1 / 88
880 likes | 980 Views
This report provides an overview of the current status of the Distributed Modeling and HydroMet Testbed (HMT) projects, focusing on the advancements in operational river forecasting. It includes results from DMIP-2 simulations, parameterizations, and the use of radar data for precipitation analysis. The analysis covers data from 2000 to 2008, showcasing the implementation and performance of distributed models in operational forecasting. Specific cases, like the Black Creek rainfall event in 2007, are examined, highlighting the application of distributed modeling in real-time forecasting scenarios.

E N D
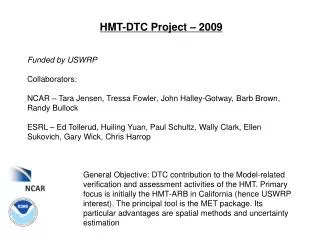
Status of DMIP 2 and HMT Mike Smith1, Victor Koren1 Seann Reed1, Ziya Zhang1, Fekadu Moreda1, Zhengtao Cui1, Yu Zhang1, Naoki Mizukami1, Shane Sheldon1, John Schaake1, Pete Fickenscher2, Eric Strem2 NOAA/NWS Office of Hydrologic Development
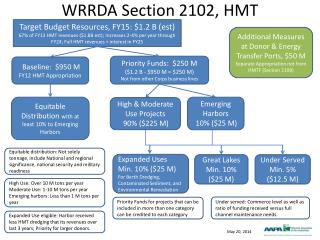
Research to Operations Path for NWS Operational Distributed Modeling DMIP 1 and OHD Research Model Publish DMIP 1 Results Major Activities RFC Use of Research Model Prototype and Requirements Develop Official Forecasting Version RFC Use Official Version DMIP 2 Publish DMIP 2 Results SAC-SMA Parameterization Snow-17 Parameterization Assimilation 2000 2001 2002 2003 2004 2005 2006 2007 2008
Status of Distributed Modeling for Operational River and Water Resources Forecasts Operational forecasting In implementation
Distributed Modeling for Operational River Forecasts Case 1: October 23, 2007 24-hour Rainfall Black Creek near Brooklyn, Miss. 5 inches in 24 hours Basin Location
Distributed Modeling for Operational River Forecasts Actual River Forecast: Black Cr. At Brooklyn, Miss. Oct. 23, 2007 Distributed model Observed flow Lumped model
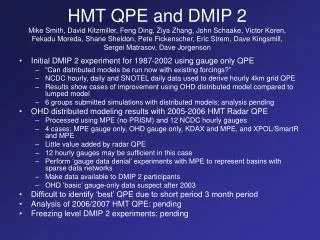
DMIP 2 Western Basins: Gauge Network for ‘Basic’ Data (mimic RFC operations) H Hourly gauges D Daily gauges SD SNOTEL daily guages Center of HRAP grids
DMIP 2 Western Basins: Leverage HydroMet Testbed Radar QPE Forest Hill Smart R (NSSL) Auburn X-POL (ESRL)
1990 1991 1992 1993 1994 1995 1996 1997 1998 1999 2000 2001 2002 2003 2004 2005 2006 2007 2008 HMT QPE Data Processing for Use in DMIP 2 ‘Advanced’ DMIP 2 Data: Multi-year time series of gridded data comprised of 1) ‘Basic’ data and 2) Processed and gridded HMT data for each IOP Step 2: Extend ‘Basic’ Data: gridded precip. and temp. from NCDC, Snotel sites Step 1: ‘Basic’ DMIP 2 Data: Time series of gridded precipitation and temperature from NCDC, Snotel sites to Dec. 2002; -Represent what the RFC uses for current Forecast operations. -Used for the initial lumped and distributed DMIP 2 simulations in the western basins. Gridded Precipitation for each IOP replaces Basic Data Analysis of Data ESRL, NSSL, OHD Step 3 Note: the time scale describes the attributes of the time series, not the schedule for processing the HMT data. The HMT observations will be processed after each campaign and inserted into the Basic Data time series. HMT-West Observations Gathered 1 2 3 Year
DMIP 2 Participants for Western Basins with ‘Basic’ Data • OHD • U. Illinois • Hydrologic Research Center • U. Bologna • U. California at Irvine • U. Nebraska at Lincoln Note: Results not yet analyzed
DMIP 2 North Fork Streamflow Simulations Using Basic Data • OHD distributed model • 48 grids, ~4km x 4km • Calibrated • Lumped model • Two elevation zones • Calibrated
DMIP 2: North Fork American River OHD Streamflow Simulations with ‘Basic Data’ March 5, 1991 Observed Flow (cms) Distributed Lumped
DMIP 2: North Fork American River OHD Streamflow Simulations with ‘Basic Data’ Lumped Flow (cms) Observed Distributed March 10, 1995
DMIP 2: North Fork American River OHD Streamflow Simulations with ‘Basic Data’ Distributed Flow (cms) Lumped Observed March 25, 1998
DMIP 2: North Fork American River OHD Streamflow Simulations with ‘Basic Data’ Distributed Flow (cms) Observed Lumped Captures diurnal snowmelt June, 1999
Initial Distributed Model Analysis of Gridded Precipitation Data:4 QPE Casesfor HMT • OHD gauge only • PRISM, 1/d1/2 • NCDC hourly/daily and SNOTEL • MPE gauge only • No PRISM, 1/d2 • 12 Hourly NCDC gauges • KDAX/gauge (MPE) • 12 Hourly NCDC gauges • NSSL/ESRL/gauge (MPE) • 12 NCDC hourly gauges • Uses KDAX/MPE as ‘fill’ between IOPs
Initial Distributed Model Analysis of Gridded Precipitation Data:4 QPE Casesfor HMT • Run distributed model to Dec 1, 2005 using OHD Basic data • Save internal states. • Use saved states as initial conditions for 4 distributed model simulations
North Fork American River Streamflow Simulations: 4 Cases OHD Basic Nov 30 – Dec 5, 2005 Observed MPE gauge only KDAX MPE NSSL/ESRL MPE
North Fork American River Streamflow Simulations: 4 Cases Dec 19-26, 2005 OHD Basic Observed Flow (cms) MPE gauge only KDAX MPE NSSL/ESRL MPE
North Fork American River Streamflow Simulations: 4 Cases Dec 28 – Jan 4, 2006 OHD Basic Observed Flow (cms) MPE gauge only KDAX MPE NSSL/ESRL MPE
North Fork American River Streamflow Simulations: 4 Cases 30 OHD ‘Basic’ QPE 20 NSSL/ESRL MPE QPE, mm 20 KDAX MPE 20 MPE gauge only Flow time
Detection of Rain/Snow Elevation Using Radar Data Snow Bright band Melting level (0 C) Height (km) Melting layer Rain Reflectivity Doppler Vertical Velocity
Proposed Freezing Level Detection Method • Rain versus Snow in the Sierra Nevada, California: Comparing Doppler Profiling Radar and Surface Observations of Melting Level, Lundquist et al., 2008, Journal of Hydrometeorology • Using Radar Data to Partition Precipitation into Rain and Snow in a Hydrologic Model, Maurer and Mass, 2006, J. Hydrologic Engineering
Conclusions • Difficult to identify ‘best’ QPE data source given short period • Uncertain quality of OHD ‘Basic’ gridded QPE data after 2003 • Density of hourly rain gauges near North Fork basin may be enough so that radar QPE doesn’t add value in this case
Recommendations • Perform data denial experiments: • Remove hourly NCDC gauges from MPE analysis to see where radar QPE begins to add value • Examine events for rain/snow • Develop approach for gridded hourly gauge-only QPE • MPE with Mountain Mapper ‘Daily QC’?
Questions • Is the 2005-2006 season enough to fairly evaluate the HMT precipitation data? • Internally • In DMIP 2 • Are initial model states derived using OHD ‘Basic’ data suitable for evaluating the HMT data • Can we define a procedure for developing gridded QPE for calibration? • What resources are needed to process HMT QPE data for 2006/2007 and 2007/2008?
Background Slides:Analysis of QPE for North Fork Basin for DMIP 2 Initial DMIP 2 period: 1987 – 2002 Extended DMIP 2 period: 1987 – 2006 (to include HMT QPE)
d4 d1 d2 PG d3 Deriving Hourly Gridded Basic QPE For Initial DMIP 2 Experiments: 1987-2002 Derive precipitation estimates using three data sources for the period of 1987-2002: 1) NCDC hourly cooperative observer (coop) gauges, 2) NCDC daily total coop gauges, and 3) SNOw pack TELemetry (SNOTEL) daily precipitation gauges. The daily values are disaggregated to hourly using thenearest hourly gauge values. The hourly values, expressed as fraction of normal, are then interpolated to approximately 4km Hydrologic Rainfall Analysis Project (HRAP)(Greene and Hudlow, 1982)grids using an inverse-distance (1/d1/2) method. Parameter- elevation Regressions on Independent Slopes Model (PRISM) (http://www.ocs.orst.edu/prism/products/) monthly precipitation climatology grids are used to compute fractions of normal at gage locations prior to the inverse distance interpolation and to convert interpolated fractions of normal to precipitation amounts at each grid point. Source: Moreda et al., 2006. Gridded Rainfall Estimation for Distributed Modeling in Western Mountainous Areas, Session H23A, AGU 2006 Spring Meeting, May 23 - 27, Baltimore, MD
1500 prism grid 1000 Annual Precip (mm) 500 0 1996 1997 1998 1999 2000 2001 2002 Checking 1987-2002 OHD Basic QPE Annual precipitation derived from grids matches the annual PRISM for the entire rectangular box Source: Moreda et al., 2006. Gridded Rainfall Estimation for Distributed Modeling in Western Mountainous Areas, Session H23A, AGU 2006 Spring Meeting, May 23 - 27, Baltimore, MD
500 400 GRID 300 Monthly precip (mm) PRISM 200 100 0 1 1996 1 1997 1 1998 1 1999 1 2000 1 2001 1 2002 500 400 y = 1.0038x 2 R = 0.9983 300 GRID (mm) 200 100 0 0 100 200 300 400 PRISM (mm) Checking 1987-2002 OHD Basic QPEfor DMIP 2 Monthly OHD QPE time series agree well with PRISM data over the area Compare PRISM and OHD QPE Over Analysis Domain High correlation between Monthly OHD QPE and PRISM monthly totals Source: Moreda et al., 2006. Gridded Rainfall Estimation for Distributed Modeling in Western Mountainous Areas, Session H23A, AGU 2006 Spring Meeting, May 23 - 27, Baltimore, MD
Checking 1987-2002 OHD Basic QPE for DMIP 2 Deriving Six - hourly Mean Areal Precipitation Deriving Six - hourly Mean Areal Precipitation (1) From the CNRFC, we obtained six - hourly MAP time series for each basin. The two basins are decomposed into subbasins based on elevation differen ces (Table 1). The CNRFC MAP time series were derived using procedures developed by Anderson (2002) employing pre - determined weights. (2) To derive an MAPX time series based on the gridded precipitatio n: • Clip the subbasin shapefiles of the elevation zones to obtain HRAP points (center) in the subbasins • Create list of HRAP points within a subbasin. • For each of hourly gridded field of precipitation, obtain hourly average precipitation for the subbasins by averaging the value of all pi xels in the subbasin • The one hourly time series is then cumulated to obtain six - hourly time series Source: Moreda et al., 2006. Gridded Rainfall Estimation for Distributed Modeling in Western Mountainous Areas, Session H23A, AGU 2006 Spring Meeting, May 23 - 27, Baltimore, MD
Comparison of OHD 6 hour QPE MAP values and CNRFC 6 hour values from historical MAP time series 1987 to 2002 Source: Moreda et al., 2006. Gridded Rainfall Estimation for Distributed Modeling in Western Mountainous Areas, Session H23A, AGU 2006 Spring Meeting, May 23 - 27, Baltimore, MD
Conclusion OHD 1987 – 2002 gridded QPE suitable for initial DMIP 2 experiments
Use HMT data Inconsistent Precipitation? Analysis of OHD Basic QPE1987 - 2006
Possible cause: bad data for the Blue Canyon station: “a lot of rain in Jan 95” was recorded as zeros in the NCDC data. CNRFC set these values to ‘missing’ in their calibration. See email by Pete Fickenscher April 22, 2008
Analysis of OHD Basic QPE1987 - 2006 • Problem: time varying bias in precipitation estimates, starting after 2003 • Analyses • Double mass analysis • Case 1: OHD QPE values to base of OHD QPE • Case 2: OHD QPE values to base of PRISM monthly accumulations • Plot OHD QPE accumulation and PXPP accumulation • Double mass analysis: OHD QPE to Observed North Fork Streamflow
1. Double Mass Analysis of OHD Basic DataCase 1: Group Base is OHD Basic Gridded QPE • Plot accumulation of grids versus average accumulation of all other OHD grids (group base). • Use NWS double mass analysis to highlight trends: • Compute deviation of grids from group base • Plot acc. deviation versus acc. of group base. For each set of 4 grids:
Grid Sets Used in Analysis of OHD Gridded QPE 1987 - 2006 3 3 3 3 2 2 4 4 2 2 4 4 1 1 1 1 Take average of 4 adjoining grids instead of using a single grid
Accumulation of Grid Set 1 versus Average Accumulation of Group Base DMA Case 1 24000 22000 20000 18000 1/2002 16000 14000 Cum. 4 pixel MAP,mm 12000 10000 8000 6000 4000 2000 0 0 2000 4000 6000 8000 10000 12000 14000 16000 18000 20000 22000 24000 26000 28000 30000 Cum. Basin MAP, mm
Accumulation of Deviation of Grid Set 1 from Group Base Plotted Versus Accumulation of Group Base DMA Case 1 0 0 5000 10000 15000 20000 25000 30000 -1000 -2000 -3000 Deviation of cum. 4 pixel MAP from cum. basin MAP, mm -4000 1/2002 -5000 -6000 -7000 Cum. Basin MAP, mm
Accumulation of Grid Set 2 versus Average Accumulation of Group Base DMA Case 1
Accumulation of Deviation of Grid Set 2 from Group Base Plotted Versus Accumulation of Group Base DMA Case 1 0 0 5000 10000 15000 20000 25000 30000 -500 -1000 -1500 Deviation of cum. 4 pixel MAP from cum. basin MAP, mm -2000 1/2002 -2500 -3000 -3500 -4000 Cum. Basin MAP, mm
Accumulation of Grid Set 3 versus Average Accumulation of Group Base DMA Case 1
Accumulation of Deviation of Grid Set 3 from Group Base Plotted Versus Accumulation of Group Base DMA Case 1 1600 1400 1200 1000 Deviation of cum. 4 pixel MAP from cum. basin MAP, mm 800 1/2002 600 400 200 0 0 5000 10000 15000 20000 25000 30000 Cum. Basin MAP, mm
Accumulation of Grid Set 4 versus Average Accumulation of Group Base DMA Case 1
Accumulation of Deviation of Grid Set 4 from Group Base Plotted Versus Accumulation of Group Base 1000 DMA Case 1 800 600 Deviation of cum. 4 pixel MAP from cum. basin MAP, mm 400 1/2002 200 0 -200 0 5000 10000 15000 20000 25000 30000 Cum. Basin MAP, mm
1. Double Mass Analysis of OHD Basic DataCase 2: Group Base is PRISM Monthly Gridded QPE For each set of 4 grids: • Plot average accumulation of grids versus average accumulation of PRISM grids (group base). • Use NWS double mass analysis to highlight trends: • Compute deviation of grids from group base • Plot acc. deviation versus acc. of group base.
NF grid1 - DMA 24000 22000 20000 18000 16000 14000 Cum. 4 pixel MAP, mm 12/96 12000 10000 8000 6000 4000 2000 0 0 2000 4000 6000 8000 10000 12000 14000 16000 18000 20000 22000 24000 26000 28000 30000 Cum. Basin MAP, mm Accumulation of Grid Set 1 versus Ave. Accumulation of PRISM Group Base DMA Case 2